Services Test Online
MSCalibrate - program scaling and shifting operations on the raw mass-spectrum data.
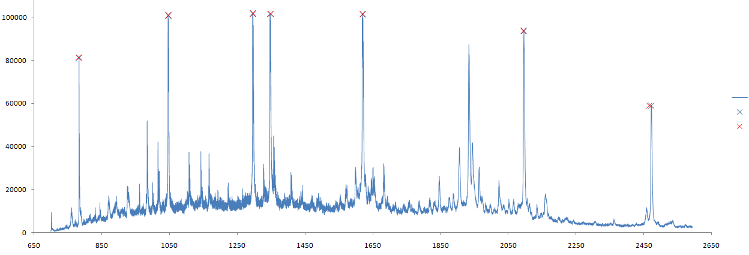
Mass spectrum data should be calibrated before analysis. The calibration allows removing systematic noise from hardware. This systematic bias can shift data along the m/z axis. Therefore each sample data after experiment ("raw" spectra) should be "re-aligned" before processing. This procedure uses scaling and shifting operations on the raw spectral data. The algorithm is based on mapping the m/z vector (mz) in the following way f : mz -> a + (mz/b)1/2, which is based on the relationship between time of flight and mass m = bi(t-ai)2. Here, ai and bi are constants and t is the time-of-flight for ions hitting the detector at a specifc clock tick. The ai and bi could be estimated using data from calibtration spectra. This calibration data is MS of samples for which location of the several peaks are known. These peaks called "calibrant markers". The location of the markers in calibration data depends on the dataset or supplier. For the calibration spectra algorithm finds ai and bi to set calibrant markers to their "true" locations. Then this transformation is applied to raw data of sample mass spectra. Example of data calibration is shown in figure 1.
| l | (a) |
 |
|
| m/z | |
| l | (b) |
 |
|
| m/z |
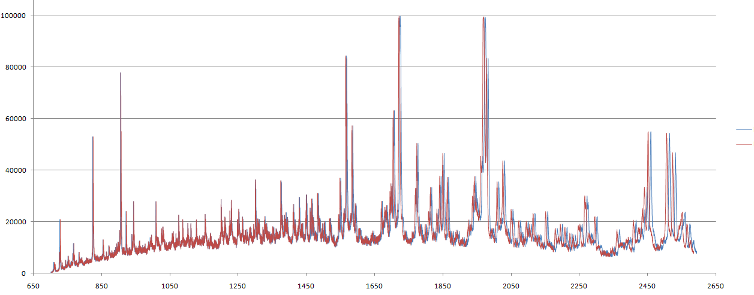
Figure 1. (a) Mass spectra for calibration data. Red crosses shows m/z values of calibrant markers. Note the nearest peaks at the right side of the plot slightly shifted from these locations. (b) Result of raw data transformation after calibration for the same m/z range as in (a). Blue line shows mass spectra before calibration, red line shows transformed spectra after calibration. The difference between them higher for high m/z values.
Input: m/z - Intensity data or raw spectra; calibration data; location of the calibrant markers.
Output: Calibrated m/z - Intensity data in the same format as input data.
Parameter(s):
Infile - This parameter specify name of file with raw data.
File format type - This parameter specify file format. SSV-space separated values, CSV - comma separated values, TSV - tab separated values.
Calibration peaks location - Text file should contain calibration data in format identical to Infile data.
Minimal mass separation - This parameter specify minimal mass separation for peaks assignment in the calibration data.
SNR window size - This parameter specify window size to determine signal-to-noise ratio for peak determination in calibration data.
Data format.
Mass spectra data represent the sets of following pairs of values: mass to charge relation
(m/z, further, for more convenience, it will be referred to as m, mass) and corresponding signal intensity (I).
On a spectrum plot, the mass corresponds to X coordinate, and signal intensity- to Y one.
A typical spectrum consists of several thousand of such value pairs (points). Data are represented as
text files, where for each pair (mi,Ii) of mass-intensity values the string is assigned, and data in
this string are separated by special separator symbol. The SMS package allows several separators types:
space (SSV, space separated values, file format), comma (CSV, comma separated values, file format) and
tabulation (TSV, tab-separated values, file format). In files with data, the string with comments are
allowed; during the file reading these strings are to be skipped. The commentary strings should begin
with "#" symbol at the first position. In the figure 2 the example of file with data in CSV format is shown.
#M/Z,Intensity
-7.8602611e-005,4.1126194
2.1773576e-007,4.0764203
9.6021472e-005,4.0040221
0.00036601382,4.1186526
0.00081019477,4.0040221
0.0014285643,3.9617898
....
19742.941,4.077895
19745.564,4.0772248
19748.187,4.0772248
Figure 2. Example file with mass spectra data in CSV format.