Services Test Online
MSPredictLDA program performs classification of patient for cancer/normal case using the mass-spectrum data and CA125 marker level.
LDA analysis of mass spectra data.
One of the perspective applications of MS data is using them for prognosis of disease. The problem can be formulated as follows: Identify peaks in serum MS data that changes their intensity in the case of disease and such that this changes can be detectable as early as possible. It was shown recently, that the information contained in mass spectra, in combination with the level of tumor marker serum CA125 useful for early detection of ovarian cancer [1].
MS data processing can be used to solve this task.
First step of analysis is data preprocessing that allow to compare MS from different patients and to identify location of peaks [1].
-
On a single spectrum processing, these procedures are used to be completed in the following order:
- Data resampling;
- Data smoothing;
- Detection of the baseline and its subtraction from intensity;
- Normalization;
- Peaks identification.
Once the peaks in different spectra are identified, they can be aligned over each other that allows to reveal the presence of common peaks in these spectra.
The Softberry SMS program package allows to perform all these steps of analysis and output the set of spectral data in a single table. In this table rows correspond to samples, each column correspond to MS intensity for the peak groups identified at the preprocessing steps.
The table can also contain additional information (that can be passed to table from additional files). For example for each sample Patient ID, time of sampling, patient status (cancer or non-cancer) can be added. Additional patient parameters that can be used for prognosis can be also added to the table as well. For example, it is known, that tumor marker serum CA125 is useful for early detection of ovarian cancer [2], also in combination with mass spectra data [1].
In this example we demonstrate that mass spectra data along with the CA125 level can be applicable to classify MS samples for cancer and non-cancer with high precision value. We used data from the paper of Gammerman et al [1]. These data represents set of mass spectrum data for serum samples taken from patients with up to 7 years prior to the cancer detection (18 patients, 75 samples). The data contain also control samples that were taken from the healthy women. The number of control samples is 154.
In this work we considered control samples as a general pool of healthy people. We did not take into account the time the control sample was taken.
The idea was that before the cancer is developed, the tumor markers (CA125 and MS peak intensity) have the same values as for control healthy peoples. Then after cancer progress, the level of marker increased and it can significantly deviate from those of control samples. This deviation can serve as early indicator of cancer.
We tested the hypothesis, whether linear combination of CA125 level and peak intensities from MS data can be useful to separate serum from cancer patients from non-cancer control samples.
To solve this task we applied Linear Discriminate Analysis. It is used in statistics and machine learning to find a linear combination of features which characterize or separate two or more classes of objects. The resulting combination may be used as a linear classifier. In our case we have two classes of samples: cancer (class 1) and control (class 0). To find the linear classifier we used patients samples taken not later than 1 month and not earlier than 6 months before diagnosis (17 samples from class1, 154 from class 0)
We used two features to build classifier: the logarithm of the CA125 tumor marker level and logarithm of intensity of MS signal for one peak group, detected by MS analysis.
The MS data analysis allowed to find 374 peak groups for all the samples taken to analysis.
Some of them were poorly represented in the dataset, some of them were highly populated. The list of top 20 highly populated peaks is shown below. NumPeaks is the number of samples where the peak intensity is significantly higher than the neighbouring background signal.
| GroupIndex | PeakID | HighMass | MeanMass | MinMass | MaxMass | NumPeaks | MaxIntensity |
| 5 | 5 | 3191.424 | 3191.554 | 3188.161 | 3193.358 | 211 | 45.57914 |
| 20 | 20 | 1770.354 | 1770.479 | 1769.719 | 1772.318 | 195 | 29.40414 |
| 18 | 18 | 2009.833 | 2009.877 | 2009.076 | 2012.017 | 193 | 30.74098 |
| 24 | 24 | 825.4889 | 825.7725 | 825.2985 | 826.2407 | 189 | 26.30554 |
| 42 | 42 | 3332.855 | 3333.192 | 3329.355 | 3334.906 | 184 | 19.21943 |
| 2 | 2 | 2026.94 | 2026.901 | 2025.914 | 2029.441 | 177 | 53.74245 |
| 37 | 37 | 2266.585 | 2267.009 | 2266.025 | 2268.258 | 177 | 20.36678 |
| 17 | 17 | 2985.269 | 2985.741 | 2983.11 | 2989.592 | 167 | 31.3781 |
| 90 | 90 | 2552.564 | 2552.984 | 2551.655 | 2554.576 | 157 | 11.41295 |
| 8 | 8 | 1894.82 | 1894.954 | 1894.057 | 1896.423 | 147 | 42.05795 |
| 78 | 78 | 2114.38 | 2114.491 | 2111.304 | 2116.45 | 147 | 13.52459 |
| 7 | 7 | 1863.57 | 1863.654 | 1862.77 | 1864.733 | 144 | 42.50182 |
| 10 | 10 | 1449.601 | 1449.102 | 1448.24 | 1451.12 | 136 | 35.4617 |
| 56 | 56 | 1584.514 | 1584.659 | 1582.731 | 1586.55 | 133 | 15.79827 |
| 55 | 55 | 2566.78 | 2567.124 | 2563.25 | 2568.585 | 132 | 16.01036 |
| 23 | 23 | 945.0417 | 944.728 | 944.0944 | 945.2638 | 130 | 27.91649 |
| 3 | 3 | 2647.767 | 2647.657 | 2646.315 | 2648.923 | 126 | 50.25482 |
| 6 | 6 | 6644.013 | 6647.589 | 6635.569 | 6651.674 | 121 | 44.14933 |
| 12 | 12 | 1395.262 | 1395.111 | 1394.238 | 1397.255 | 120 | 34.98699 |
We examined all the peaks from 20 from table above in combination with CA125 level to build linear classifier. We select the peak groub that delivers the best prediction performance.
For example, the best overall performance was achieved for combination of CA125 and peak group 17 (located within the min mass 2983.11, max mass 2989.592).
Prediction results for this peak shown below:
Number of samples=171 (control(0)=154;disease(1)=17)
Class0 (control)  (num/fract)=24/0.140351; mean_score=4.152928
Class1 (disease ) (num/fract)=147/0.859649; mean_score=-5.309040
Test results:
Fraction of true predictions: 0.959064[164]
Class 0:
Fraction of true  positives : 0.954545[147]
Fraction of false negatives : 0.045455[7]
Class 1:
Fraction of true  positives : 1.000000[17]
Fraction of false negatives : 0.000000[0]
The overall fraction of true predictions is 0.959064. Interestingly, this classifier does not misclassified any cancer sample (17 true positives from 17). This can be useful as no cancer patient can be missed by this analysis.
The change of the linear discriminant function for this classifier (CA125 + 17 group peak intensity, LDF) is shown in figure below for each cancer patient samples for all times before diagnosis (including time=0, the time of diagnosis).
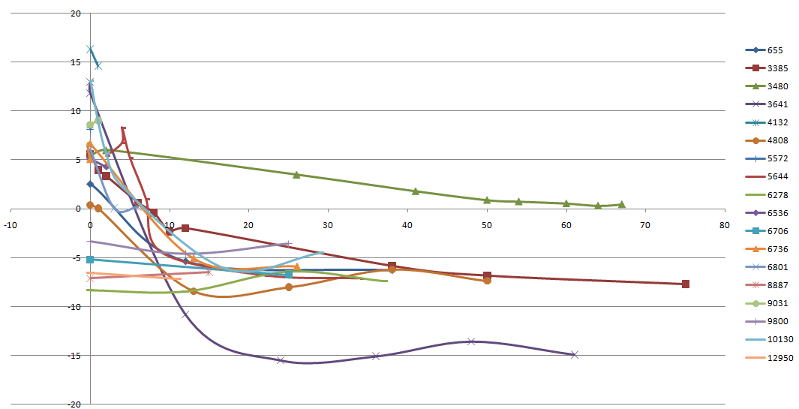
The X axis - time before diagnosis. For most samples the LDF value exceed zero in the range 10 months before diagnosis.
Y-axis - LDF value. 5 samples show no increase of LDF values for this period (they have only two of time points of samples
taken: time=0 and time > 6 months). One patient (ID 3480) have LDF value greater than zero for all period of time. T
hus positive LDF values based on CA125 and MS peak intensity [2983.0, 2989.6] can be used as OC markers for prognosis
within 6 months.
[1] Gammerman et al, The Computer Journal, (2008)
[2] Menon et al, (2007), J.Clin.Oncol, 23,7919-7926.