Services Test Online
SyGraph help
Contents
1. Graph exploration
2. Contigs selection
3. Visualisation the pattern by pie chart construction
1. Graph exploration
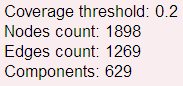
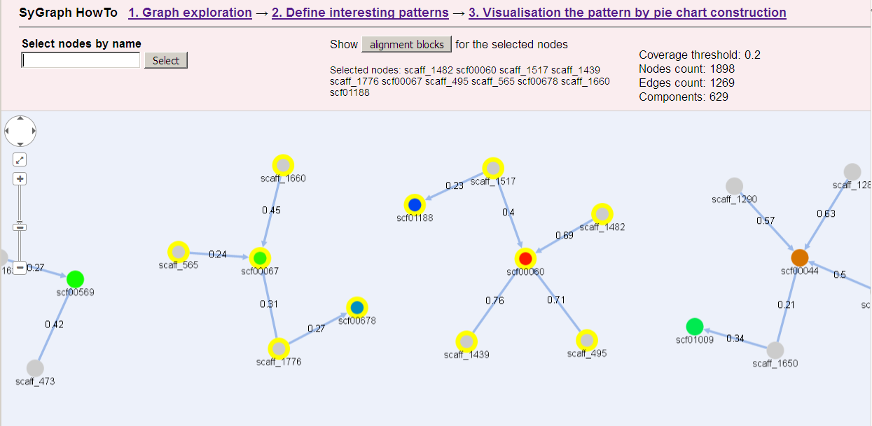
To resolve the problem of visualization of synteny within a large set of genomic fragments, we suggest a method based on reconstruction and visualization of graphs representing the relationships between genomic fragments. The method is based on building a directed, weighted, bipartite graph, nodes of which represent contigs, and the weights of edges denote the coverage of contigs' pairwise alignments.
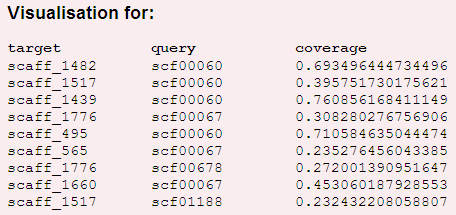
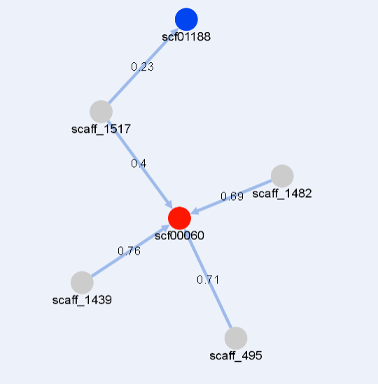
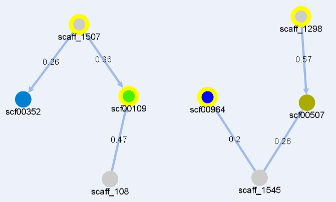
The image below shows a graph representing relationships between genomic fragments.
The nodes representing targeted contigs are shown in gray, while those representing query contigs are colored.
The color of query contigs' nodes varies in the spectrum from red to blue, depending on alignment coverage.
A table in a top left corner contains some information about contigs:
Moving a graph
-
A graph can be moved by:
- dragging it with mouse;
-
using a
 button
To move several contigs, first select them with a mouse and then drag.
Scaling a graph
-
A graph can bezoomed in and out by:
- using a mouse wheel;
- using a panzoom widget on the left side of a picture.
To restore initial scale, use a ![]() button
button
2. Contigs selection
-
A contig can be selected by:
- clicking it by a mouse;
-
using "Select nodes by name" field:
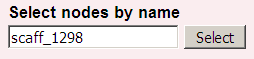
A selected contig will be marked yellow.
-
Several contigs can be selected by:
- clicking on them sequentially by holding a "Ctrl" or "Shift" key
- drawing a rectangular area by a mouse while holding a "Ctrl" key. All contigs in that area will be selected.
Selected contigs will be marked yellow.
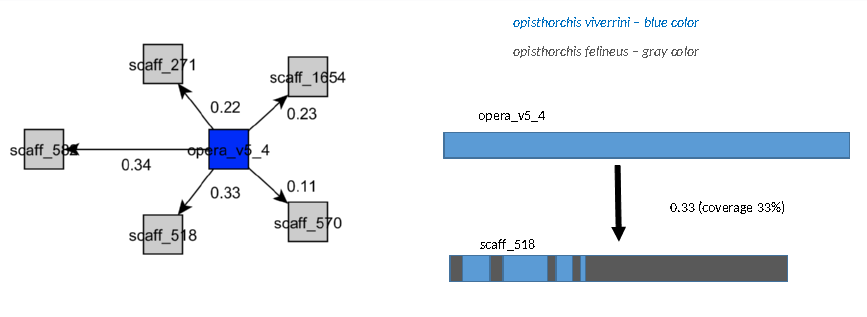
3. Visualizing a pattern as a pie chart
Via Circosa pie charts allow detailed visualization of relationships between several contigs.
-
To create a pie:
- Select target and query contigs. They will be listed in a "Selected nodes" list.
-
Press the
 button.
Target contigs are shown in gray, query contigs are colored.
The color of links (blocks of alignment) varies in the spectrum from red to blue, depending on the coverage.
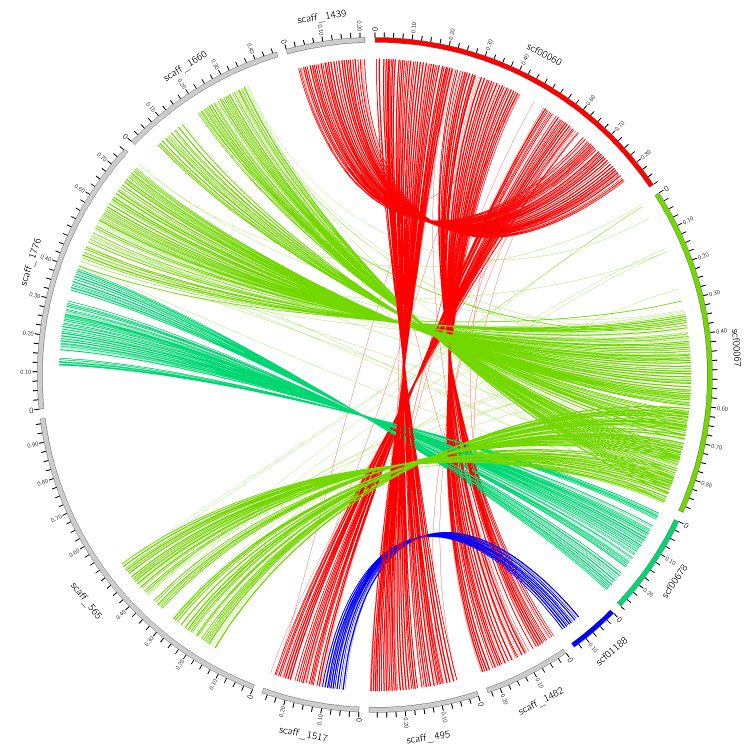
A table in a top left corner contains a list of contigs and their coverage.