GenomeMatch Viewer provides the possibility to visualize the sites of homology between the sets of sequences.
|
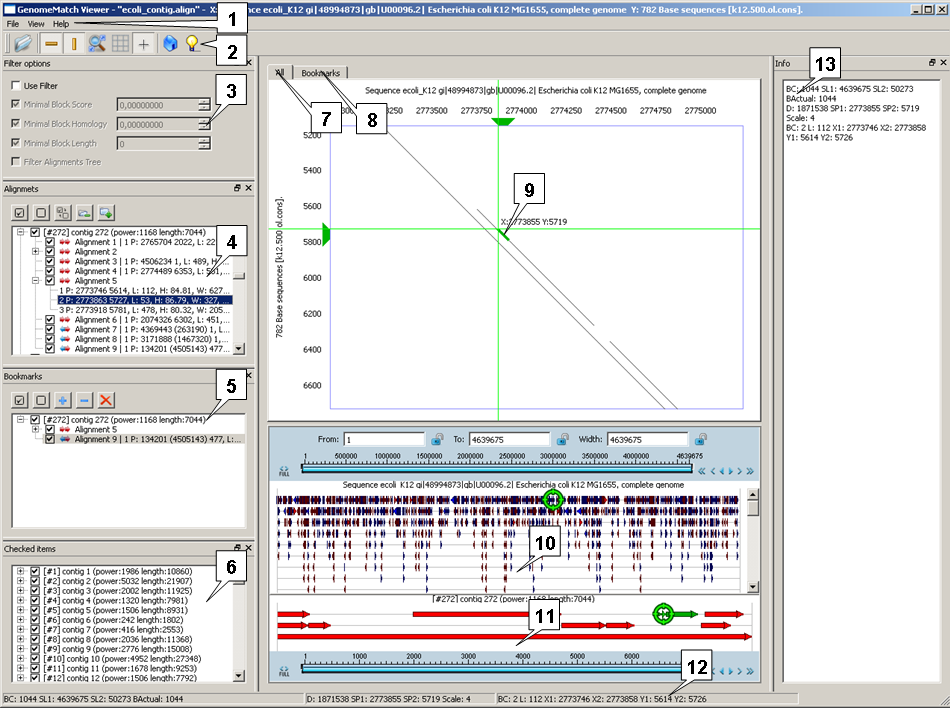
| 1. Main menu. 2. Toolbar. 3. "Filter Options" window. 4. "Alignments" window. 5. "Bookmarks" window. 6. "Checked items" window. 7. DotPlot Map - "All" Tab. 8. DotPlot Map - "Bookmarks" Tab. 9. Block of alignment highlighted on the map. 10. Comparison Map - Target part. 11. Comparison Map - Query part. 12. Status bar. 13. "Info" window. |
| File > Open File | |
| View > Vertical move | |
| View > Horizontal move | |
| View > Reset | |
| View > Show grid | |
| View > Show Cross | |
| Help > About | |
| Help > Visit Website |
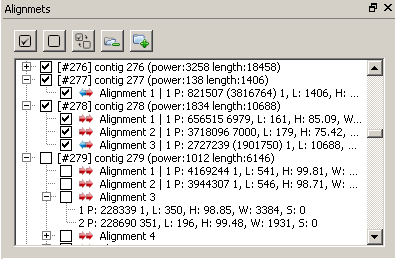 |
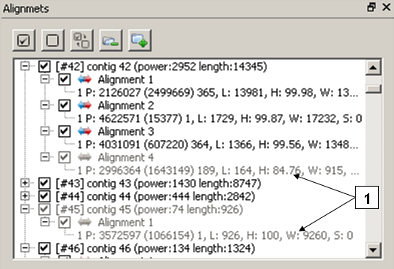
The window contains the hierarchical list of loaded alignments (Sequence>Alignment>Blocks of alignment).
To display/hide an alignment on the map just check in/out the appropriate checkbox.
Color arrows near the alignment title indicate the mutual orientation of target and query strands of alignment: red arrow corresponds to direct strand, blue one ¢ to reverse strand.
The string that corresponds to alignment block contains the following:
| 1 | Block number. |
| P: 377586 724 | Positions of similarity block' start in target and query sequences appropriately. |
| L: 27 | Length of this similarity block. |
| H: 96.29 | Homology of this similarity block. |
| W: 293 | Weight of this similarity block (the arithmetic sum of symbols' similarity calculated from the given similarity matrix). |
| S:0 | Score of this similarity block. |
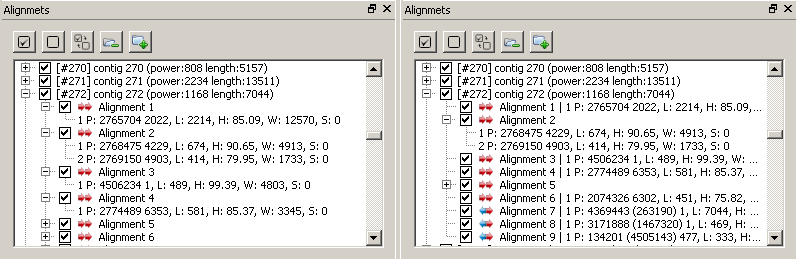
Double click over the element of the Alignment list positions its image in the center of the map.
When the "View>Show selection on the map" option is enabled, then click over the element of the list leads to its highlighting on the map.
When the "View> Hide single blocks" option is enabled, the single-block alignments are being modified by removing a sub-node element and placing all information into alignment title modify a single-block alignments by removing a sub-node element and placing all information into alignment title.
Elements of the list with "Enabled" status are shown in the "Checked items" tab of the map.
|
|
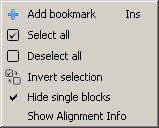
- allows to check all alignments of the list. |
|
|
- check out the check-boxes of all elements in the "Alignment window" list and clear the "Checked items" list. |
|
|
- inverts the check status of alignments in the list. |
|
|
- collapse all list items. |
|
|
- expand all list items. |
 |
 |
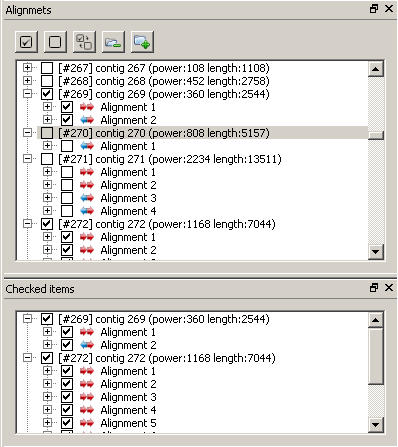 |
The window contains the elements of the "Alignments" list with "Enabled" status.
 |
|
 |
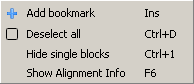
Elements of the "Bookmarks" list with "Enabled" status are shown in the ōBookmarksö tab of the map.
|
|
- allows to check all alignments of the list. |
|
|
- check out the check-boxes of all elements in the "Alignment window" list and clear the "Checked items" list. |
|
|
- remove the current (selected) element of the list from bookmarks. |
|
|
- add a selected element of the list (in the "Alignments" or "Checked" window) to bookmarks. |
|
|
- clear the list of bookmarks. |
|
|
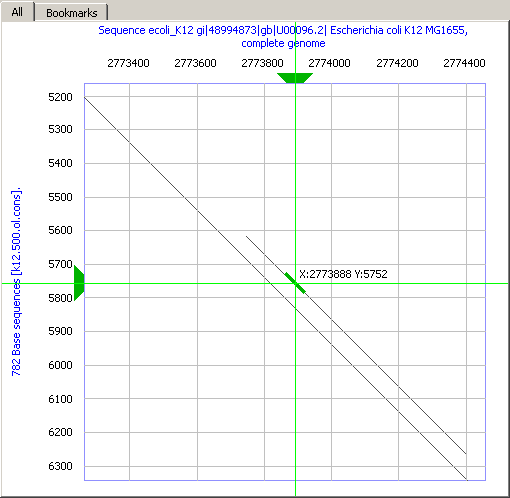 |
DotPlot Map displays alignments from the loaded file.
To display/hide an alignment on the DotPlot Map the appropriate checkbox at the "Alignments" window is to be checked in/out.
Click on alignment (or block) selects it on DotPlot Map. The selected alignment block is marked with green color.
On disabled buttons/commands the DotPlot Map scale changes only.
On enabled buttons/commands both DotPlot Map scrolling and scaling are allowed.
On selecting a rectangle on the map (drawing a rectangle at hold "Shift" key), the coordinates of a selection are shown near the cursor.
"Reset zoom" button changes the DotPlot Map area to fit the image size.
On enabled Show Cross position button/command the current mouse cursor position is marked with vertical and horizontal lines.
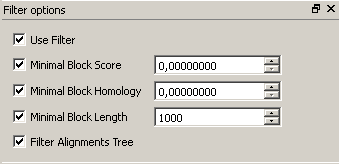
The "Filter Options" window allows to specify the conditions for blocks displaying (only those blocks that meet the filter criteria are to be displayed).
Marks on the coordinate axes make it easy to find a selected alignment or block of alignment on the DotPlot Map.
If on pointing of the mouse cursor over a block the information on this block appears in the status bar, then clicking on it allows to copy this information to clipboard.
On selecting a rectangle on the DotPlot Map (drawing a rectangle at hold "Shift" key), the coordinates of a selection are shown near the cursor. If the "View>Auto erase ruler" option is disabled, then upon a completion of such an operation the drawn rectangle with information on its size (coordinates) remains on the DotPlot Map, otherwise it disappears.
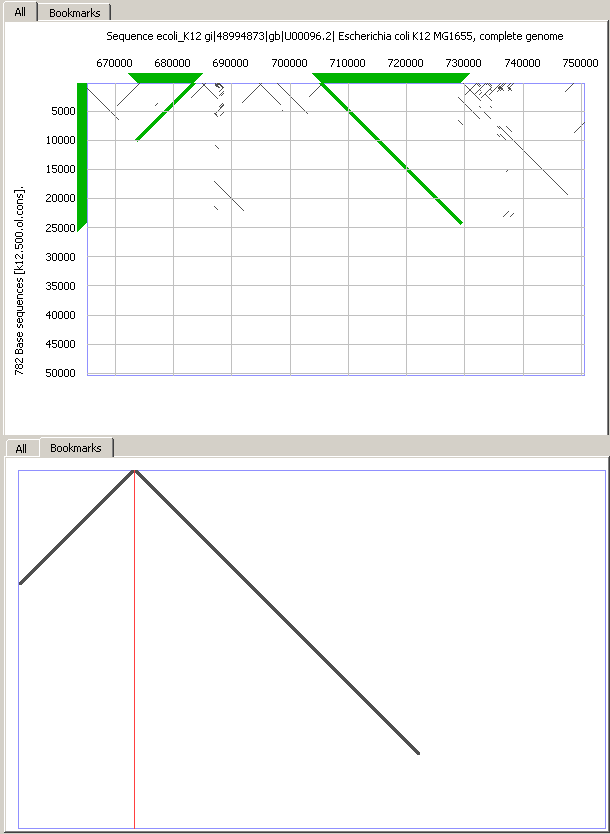 |
The tab displays the selected in the "Bookmarks" window alignments in compact variant ¢ the parts of the matrix, located between alignments (both on a vertical and on a horizontal), are substituted with cutlines. The "View>Show cutlines" option enables/disables the cutlines visualization.
To display/hide an alignment on the map the appropriate checkbox at the "Alignments" panel is to be checked in/out.
On disabled buttons/commands the DotPlot Map scale changes only.
On enabled buttons/commands both DotPlot Map scrolling and scaling are allowed.
"Reset zoom" button changes the DotPlot Map area to fit the image size.
On enabled Show Cross position button/command the current mouse cursor position is marked with vertical and horizontal lines.
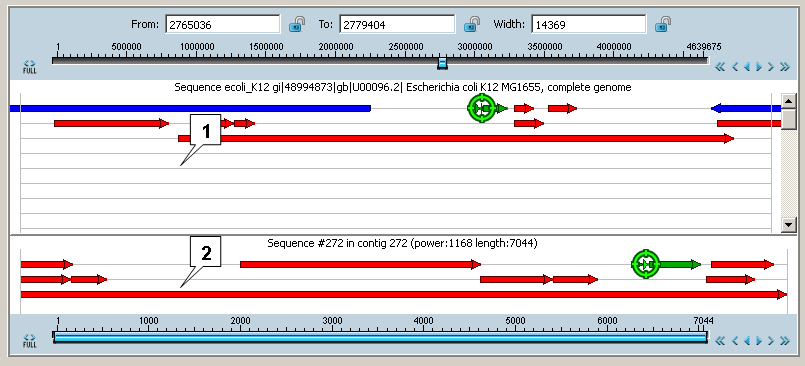 |
| 1. Target (reference) part. 2. Query part. |
ōComparison Mapö consists of two parts ¢ ōTarget (reference) partö and ōQuery partö.
The Comparison Map provides a schematic visualization of selected data. The Comparison Map allows the scaling of the loaded region.
Alignments are imaged as arrows. Alignment in direct strand corresponds to red arrow (![]() ), alignment in reverse one ¢ to blue arrow (
), alignment in reverse one ¢ to blue arrow (![]() ).
).
Overlapped alignments are shown in multiple layers on the map.
Click on alignment (or block) selects it and positions on both parts of ōComparison Mapö and in the ōAlignmentsö list, as well as highlights it at the ōAllö tab of the dot-plot map.
The selected alignment block is marked with green color. If the selected block has a small size at the current scale
on ōTarget partö or ōQuery partö, it is marked with a circle ![]() (for more convenience).
On changing the map scaling up to a certain level, the circle disappears.
If the ōView> Highlight alignmentsö option is enabled, then on click on the alignment block the whole alignment is highlighted
(
(for more convenience).
On changing the map scaling up to a certain level, the circle disappears.
If the ōView> Highlight alignmentsö option is enabled, then on click on the alignment block the whole alignment is highlighted
(![]() ), otherwise the only block itself is highlighted
(
), otherwise the only block itself is highlighted
(![]() ).
).
On placing the cursor over an alignment, the information on this alignment is displayed in the ōInfoö panel.
It schematically visualizes all found alignments on Target sequence. In the upper part it contains the fine navigation and graphic navigation panels (The slider movement area corresponds to loaded sequence). Below the graphic navigation panel there is the name of Target sequence.
If an alignment (or its block) is selected either in the ōAlignmentsö list or in the ōTarget partö, or on the ōAllö tab of the DotPlot Map, then it is schematically visualized in the Query part. If for the query sequence, to which the selected alignment (or its block) belongs, multiple alignments are found, then all of them are shown in the Query part along with the selected one. In the upper part the name of Query sequence is located. In the lower part there is the graphic navigation panel. The slider movement area corresponds to loaded sequence. Overlapped alignments are shown in multiple layers.
The graphic navigation bar allows to select approximate borders of a region to be displayed on the map.
The slider movement area corresponds to loaded region.
To the left of navigation bar the
![]() button is located. Clicking this button leads to selection of all
loaded region. In this case the slider occupies the
whole movement area.
button is located. Clicking this button leads to selection of all
loaded region. In this case the slider occupies the
whole movement area.
To the right of navigation bar the shift buttons are located.
Clicking some of the buttons
![]() or
or
![]() leads to shift of a selected region
(and the slider itself) in appropriate direction on current map size.
leads to shift of a selected region
(and the slider itself) in appropriate direction on current map size.
Clicking on the movement area to the left or to the right of the slider leads to shift of the map in appropriate direction for current map width.
Clicking some of the buttons
![]() or
or
![]() leads to shift of a selected region
(and the slider itself) in appropriate direction on 20% of
current map size.
leads to shift of a selected region
(and the slider itself) in appropriate direction on 20% of
current map size.
Clicking some of the buttons
![]() or
or
![]() leads to shift of a selected region
(and the slider itself) in appropriate direction on 10 nucleotides.
leads to shift of a selected region
(and the slider itself) in appropriate direction on 10 nucleotides.
Note. One of these parameters (From, To or Width) can be
locked by pressing the ![]() button. Once it is done, all other specified parameters need to be recalculated with regard to the locked parameter.
To apply changes, press Enter.
button. Once it is done, all other specified parameters need to be recalculated with regard to the locked parameter.
To apply changes, press Enter.
 |
 |
| 1. Non-active blocks. |
Note. The filtering options are applied only to alignments blocks that are set to displaying by checking at the "Alignments" window.
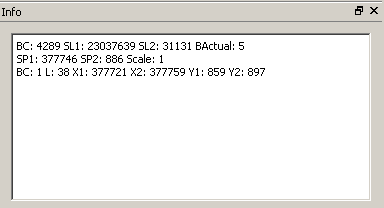 |
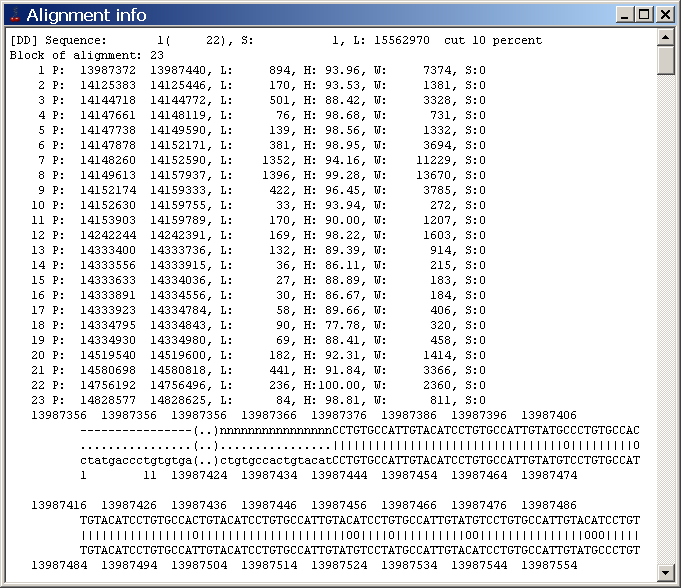
Contains the information on an alignment and currently pointed block (the same information as in the Status Bar). The content can be copied to clipboard by either the "View>Copy info" command of the main menu or by pressing F5 key.
The status bar displays:
BC Ś the number of loaded blocks
SL1 Ś length along the X axis
SL2 Ś length along the Y axis
BActual Ś the number of displayed blocks (after applying of filtering options).
On moving the mouse over map:
SP1 Ś position on X axis
SP2 Ś position on Y axis
Scale Ś image scale
On pointing the mouse over meaningful map sites (containing a block or more):
bc Ś the number of blocks that fall to the current point;
x Ś starting position of the block on the first sequence;
y Ś starting position of the block on the second sequence;
l Ś block length.