Structure Graph panel
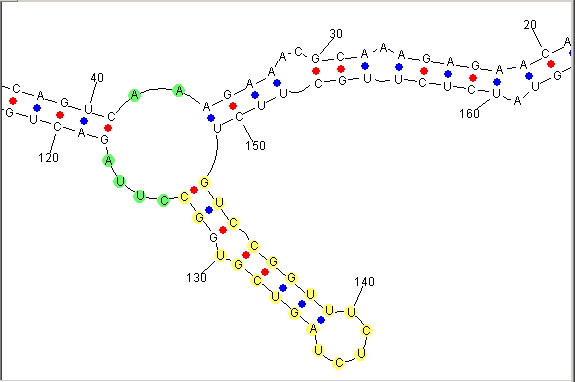
Structure Graph panel is where a visual representation of a predicted secondary structure is displayed.
Colored circles denote bonds between nucleotides that form a complementary pair:
red filled circles denote the GC bonds, blue filled circles denote the UA or UG bonds.
Viewing. Two view modes are available:
- Full View - Displays all the nucleotides of a structure and their enumeration.
Use the View>Full view command on the menu bar to enable this mode.
- Outline view - Loops are displayed as circles; helices are displayed as lines.
Use the View>Outline view command on the menu bar to enable this mode.
- Moving a structure - Use drag-and-drop to move a structure around.
- Rotating a structure - Hold down the Ctrl key and move the mouse cursor up to rotate a structure clockwise or down
to rotate a structure counterclockwise.
- Zooming a structure - Hold down the Shift key and move the mouse cursor up to zoom in or down to zoom out.
Notes.
To load the initial image of the structure, click the  toolbar button.
To make the structure fit the view area, click the  toolbar button.