Services Test Online
Content
- Introduction
- Main window
- Main menu commands
- Toolbar buttons
- Structure list
- Viewing a structure
- Structure Graph pane
- Selection Types
- Map pane
- Info pane
- Loading a structure
- Saving the current display of a structure
Introduction
The application is made for visualization and manipulation of RNA secondary structure predicted using MolQuest.
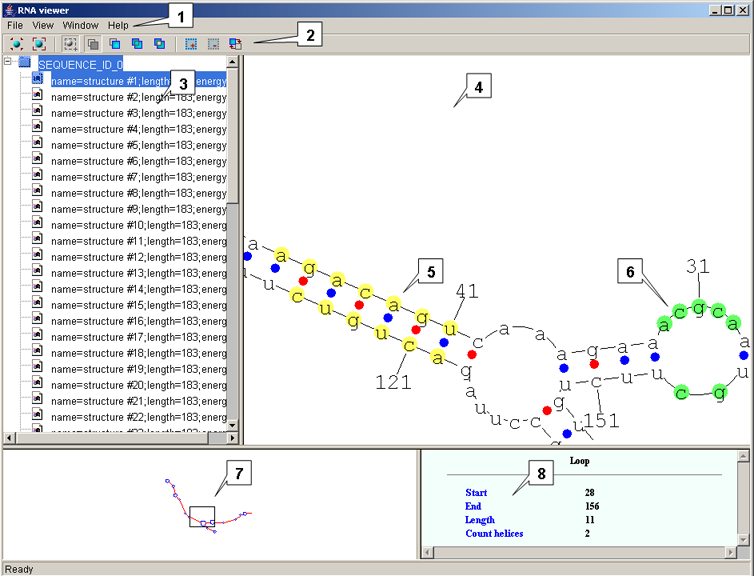
Main window
The main window contains:
- The Menu bar
- The Toolbar
- The Structure list
- The Structure Graph pane
- The Map pane
- The Info pane
Main menu commands
File
- Load sequence - N/A
- Load sequence and ss data - Displays the "Load sequence and SS" dialog, which is used to load a structure.
- Send to postscript - Displays the "Export postscript file dialog" dialog, which is used to save the current image as a postscript file.
- Close - Closes the current window.
- Exit - Closes the application.
View
- Outline view - Displays a simplified view of a structure. Loops are displayed as circles; helices are displayed as lines.
- Full view - Displays a detailed view of a structure. All the nucleotides are displayed.
- Reset transformations - Resets the initial structure position.
- Fit to window - Scales the view of a secondary structure to fit the Structure Graph pane.
- Sort - Sorts the list entries:
- Alphabetically - Sorts the list entries in alphabetical order.
- By loading order - Sorts the list entries in the order in which they were loaded into the application.
Window
- Circle diagram - Displays a structure as a circle diagram.
- Structure view - Displays a structure in Vienna format.
Help
- About - Displays the "About" dialog.
Toolbar buttons
| Reset Transformations - Resets the initial structure position. | |
| Fit To Window - Change the structure size to fit the view area. | |
| Selection mode - Switches between selection types. | |
| Add selection mode - Enables the mode to select a helix or a loop by clicking the nucleotide that the helix or the loop contains. | |
| Normal selection mode - In this mode, each subsequent selection unselects the previously selected item. | |
| OR selection mode - In this mode, all subsequent selections are added to the previously selected items. | |
| XOR selection mode - In this mode, a previously selected item is unselected by subsequent selection. | |
| Inverse selection - Invert a selection. | |
| Select all - Selects the entire structure. | |
| Unselect all - Unselects the entire structure. |
Structure list
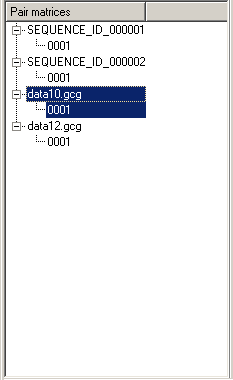
Because a sequence may have more than one structure, the list is in the form of a tree. A tree node displays the label of a sequence (or a filename); secondary nodes are a list of structures that correspond to the sequence (the enumeration is done by the application). Use the View->Sort command on the menu bar to change the order in which the tree nodes appear on the Structure list. A structure selected in the Structure list is displayed on the Structure Graph pane.
Viewing a structure
Circle diagram
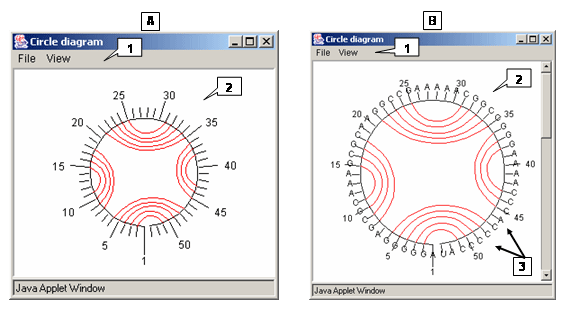
The "Circle diagram" dialog is used to display a structure as a circle diagram. Use the Window>Circle diagram command on the Menu bar to display this dialog. The circle (Fig.A) contains the numbered nucleotides of the structure. Arcs connect nucleotides that form a complementary pair.
- Menu bar commands
- File>Save to PS. Saves the current circle diagram as a postscript file.
- View>Always show residue labels. Displays the label for each nucleotide of a structure (Fig. �).
Vienna format
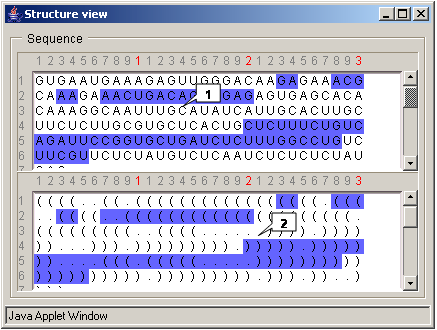
The "Structure view" dialog is used to view a primary structure and a bracket representation of a secondary structure. Use the Window>Structure view command on the Menu bar to display this dialog. The upper pane displays the nucleotide sequence of a structure. The lower pane displays a secondary structure. Each pair of parentheses ... (..)... corresponds to a Watson-Crick (complementary) pair. The opening parenthesis represents the most 5' nucleotide of the complementary pair, the closing parenthesis represents the most 3' nucleotide of the complementary pair. The dot "." represents a nucleotide which is not paired.
The nucleotides that are currently selected on the Structure Graph pane are highlighted in blue.
Structure Graph pane
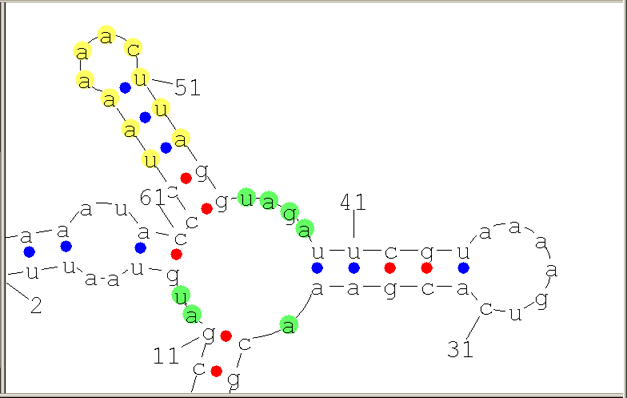
Structure Graph pane is where a visual representation of a predicted secondary structure is displayed. Colored circles denote bonds between nucleotides that form a complementary pair: red filled circles denote the GC bonds, blue filled circles denote the UA or UG bonds.
- Viewing. Two view modes are available:
- Full View - Displays all the nucleotides of a structure and their enumeration. Use the View>Full view command on the menu bar to enable this mode.
- Outline view - Loops are displayed as circles; helices are displayed as lines. Use the View>Outline view command on the menu bar to enable this mode.
- Moving a structure - Use drag-and-drop to move a structure around.
- Rotating a structure - Hold down the Ctrl key and move the mouse cursor up to rotate a structure clockwise or down to rotate a structure counterclockwise.
- Zooming a structure - Hold down the Shift key and move the mouse cursor up to zoom in or down to zoom out.
Notes.
To load the initial image of the structure, click the ![]() toolbar button.
toolbar button.
To make the structure fit the view area, click the ![]() toolbar button.
toolbar button.
Selection Types
- The application allows for two selection types:
- Selection for manipulation. Selected fragments of the structure are highlighted in green. This is a default selection type.
- Selection for analysis.
Selection for manipulation
When this selection type is activated, selected fragments of the structure are highlighted in green.
- The following manipulations are available:
- Varying loop radii. Select a loop. Hold down the Shift key and move the mouse cursor down to increase the radius of the loop or up to decrease the radius of the loop.
- Moving a helix around the loops. Select a loop. Use the mouse to select a helix, hold down the key and move the mouse cursor up to move the helix clockwise relative to the loop or down to move the helix counterclockwise relative to the loop.
NOTE.
Ensure that there is enough spacing on the arc between two helices before using this action.
To increase spacing, increase the radius of the loop.
Selection for analysis
When this selection type is activated, selected fragments of the structure are highlighted in yellow.
Choose the ![]() button the activate this selection type.
button the activate this selection type.
When the ![]() toolbar button is switched on, the following buttons become available:
toolbar button is switched on, the following buttons become available:
![]() - Add selection mode. Enables the mode to select a helix or a loop by clicking the nucleotide that the helix or the loop contains.
- Add selection mode. Enables the mode to select a helix or a loop by clicking the nucleotide that the helix or the loop contains.
![]() - Normal selection mode - In this mode, each subsequent selection unselects the previously selected item.
- Normal selection mode - In this mode, each subsequent selection unselects the previously selected item.
![]() - OR selection mode - In this mode, all subsequent selections are added to the previously selected items.
- OR selection mode - In this mode, all subsequent selections are added to the previously selected items.
![]() - XOR selection mode - In this mode, a previously selected item is unselected by subsequent selection.
- XOR selection mode - In this mode, a previously selected item is unselected by subsequent selection.
Click the ![]() toolbar button to invert a selection.
Click the
toolbar button to invert a selection.
Click the ![]() toolbar button to select all elements in the model.
Click the
toolbar button to select all elements in the model.
Click the ![]() toolbar button to unselect all elements of the model.
toolbar button to unselect all elements of the model.
NOTE.
The selection made for analysis is automatically displayed in the "Structure view" dialog.
Map pane
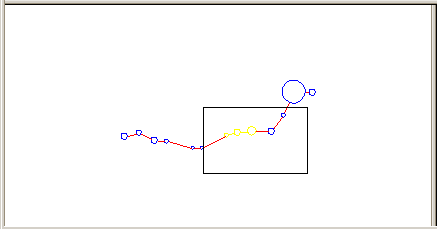
The Map pane displays a simplified view of a structure and is made for easy navigation across the structure. Drag the rectangle to the area of the image you want to see on the Structure Graph pane. Manipulation of the structure on the Structure Graph panee will affect the image of the structure on the Map pane.
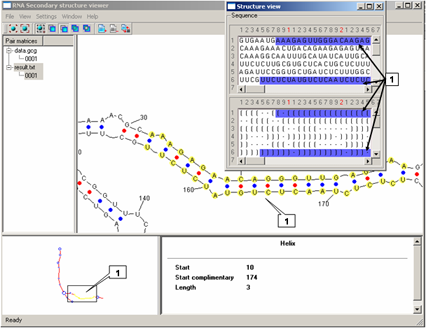
Info pane
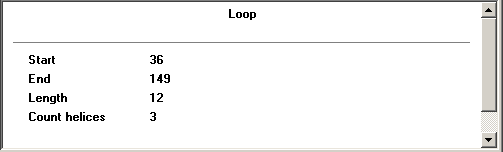
The Info pane displays information about the element of the structure to which the mouse cursor points:
For a helix: displays the length of the helix and the numbers of the nucleotides that make up the start of the helix.
For a loop: displays the length of the loop, the numbers of the start and end nucleotides in the loop, the number of helices emerging from the loop.
Loading a structure
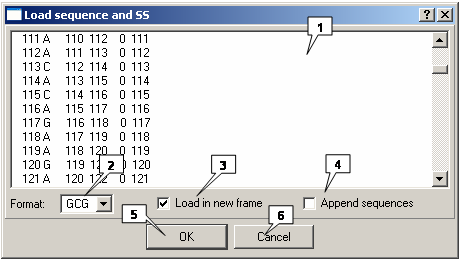
The "Load sequence and SS" dialog is used to load a structure. Use the File>Load sequence and ss data command on the Menu bar to display this dialog.
- Text box 1 is used to insert the nucleotide sequence of a structure.
- The "Format" list box is used to choose the format in which you want the secondary structure to be presented. If the format is incorrect, the application will be unable to proceed with loading a structure.
The "Format" list contains the following formats to choose from:
- The GCG - GCG format.
- Load in new frame. Tick this check-box to load a structure to a new window.
- Append sequences. Tick this check-box to load a structure to the current window.
- OK. Select this button to close the window and load the structure.
- Cancel. Select this button to cancel loading a structure.
Saving the current display of a structure
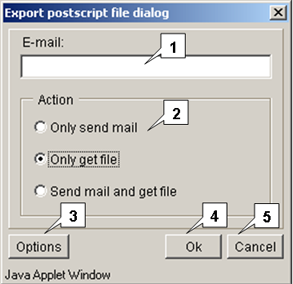
The File>Save to postscript command on the Menu bar and the File>Save to PS command on the "Circle diagram" dialog display the "Save postscript" dialog, that provides obtaining a structure image from the server. The postscript file can be retrieved by the following means:
- Only send e-mail - to send a file with data by e-mail (the address is to be entered in the "E-mail" field).
- Only get file - to download a file.
- Send mail and get file - both of above.
This combo box is used to specify a file name.
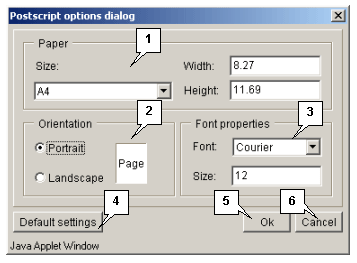
Options. Select this button to display the "Postscript options dialog",
which is used to specify the options contained in a data file (page size and orientation, fonts).
OK. Select this button to apply the changes that have been made and close the window.
Cancel. Select this button to cancel the changes that have been made.
Select this button to change the options contained in a data file (page size and orientation, fonts) to default settings.