Constructing and Visualizing synteny for assembled genomes
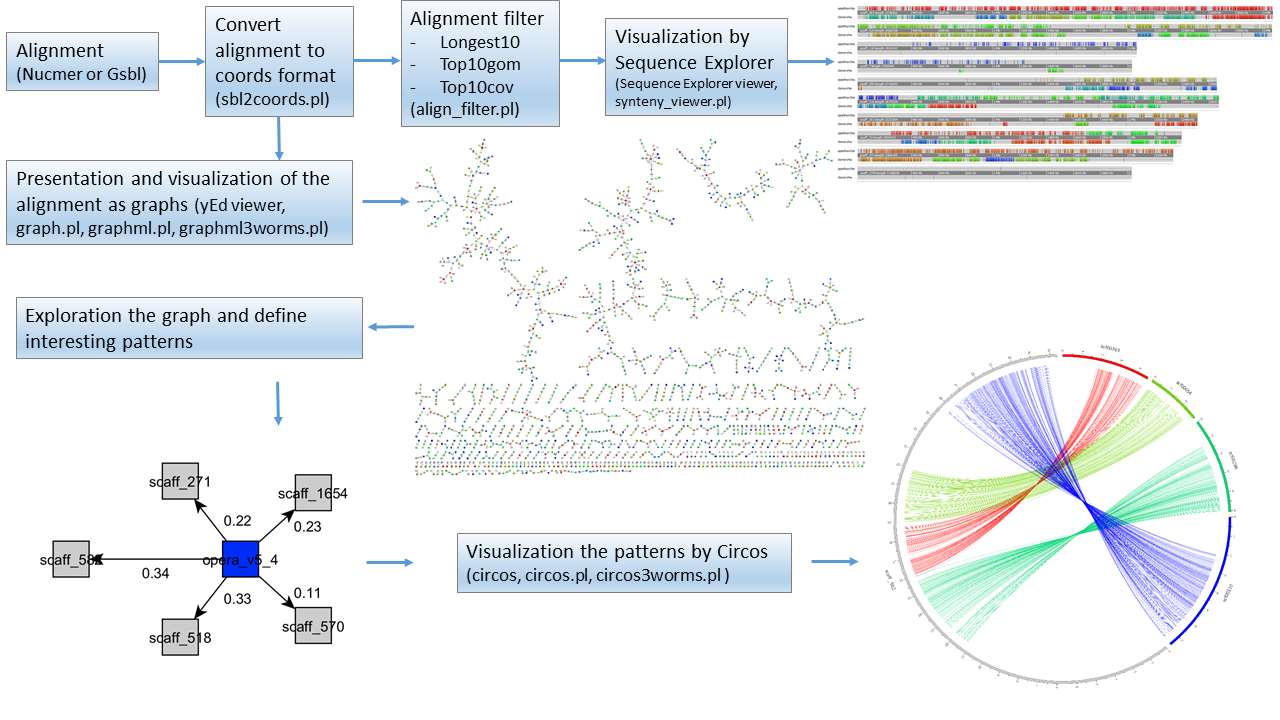
We provide a system for identifying and displaying genome synteny alignments. Our proposed method is schematically shown in the figure below:
Constructing Synteny
Synteny research is carried out on the basis of alignments, which we can construct using Mummer or Softberry GenomeMatch program. Suppose we start with genome assemblies of two worms, opisthorchis_viverrini.fa and clonorchis_sinensis.fa, and we want to explore synteny between them. Each assembly includes several thousand contigs. Let's generate alignment files in coords format using Softberry GenomeMatch and nucmer programs.
Synteny research takes place on the basis of alignments. The result of synteny calculation is a file in the coords format. In this format, each line is an alignment block, which is described by eight mandatory fields:
| S1, E2 | the coordinates of start and end of a block on a target |
| S2, E2 | the coordinates of start and end a block on a query |
| LEN1, LEN2 | lengths of target and query blocks |
| IDY | homology (percent) |
| TAGS | names of target and query sequences. |
Constructing Synteny using Softberry GenomeMatch
GenomeMatch pipeline performs alignment of large genomic sequences and searches for the best coverage for each of target sequences from a set of query sequences. The following results are achieved for synteny:
- 1. A resulting alignment is optimized for maximize the total length of each block.
- 2. The program seeks, if possible, to use blocks of an initial alignment in a resulting alignment, i.e blocks located on the same diagonal of dotplot matrix. To move to a different alignment, it selects the closest diagonal, ie the number of InDels in a target sequence is minimized.
Example of use:
#Get raw aligns
../bin/gsbl opisthorchis_viverrini.fa clonorchis_sinensis.fa -o:../bin/gsbl.cfg -D:2  -info:0 -Info:1  -da -j:-3 -info:1
#Sort aligns by target
../bin/daSort opisthorchis_viverrini.fa clonorchis_sinensis.fa -o:../bin/gsbl.cfg -da:./opisthorchis_viverrini.fa#clonorchis_sinensis.fa#00.da -suffix:srt -sort:Target
#Find best path
../bin/synteny opisthorchis_viverrini.fa clonorchis_sinensis.fa -o:../bin/gsbl.cfg -da:./opisthorchis_viverrini.fa#clonorchis_sinensis.fa#srt.da -suffix:syn -pr:tc -sy_swsl -sy_seq_path -da > al.syn
#output detail blocks for target seq 1  and query seq 2
../bin/daBrowse opisthorchis_viverrini.fa clonorchis_sinensis.fa -o:../bin/gsbl.cfg -da:./opisthorchis_viverrini.fa#clonorchis_sinensis.fa#syn.da -pr:tb -From:1 -To:1 -from:2 -to:2 > al1_2.syn
#convert results to coords format
./sbl2coords.pl opisthorchis_viverrini.fa clonorchis_sinensis.fa al.syn > opisthorchis_viverrini_vs_clonorchis_sinensis.coords
Constructing Synteny using nucmer
NUCmer is a robust Perl script pipeline for the alignment of multiple closely related nucleotide sequences, which allows for multiple reference and multiple query sequences to be aligned in a many vs. many fashion. For instance, a very common use for nucmer is to determine a position and orientation of a set of sequence contigs in relation to a finished sequence, however it can be just as effective in comparing two finished sequences to one another. Like all of the other alignment scripts, it is a three-step process - maximal exact matching, match clustering, and alignment extension. It begins by using mummer to find all of the maximal unique matches of a given length between the two input sequences. Following a matching phase, individual matches are clustered into closely grouped sets with mgaps. Finally, the non-exact sequence between matches is aligned via a modified Smith-Waterman algorithm, and the clusters themselves are extended outwards in order to increase the overall coverage of the alignments.
Example of use:
nucmer --mumreference --maxgap=500 -c 100 --coords -p opisthorchis_vs_clonorchis opisthorchis_viverrini.fa clonorchis_sinensis.fa
GenomeMatch vs NUCmer comparison
Comparison of alignment Opisthorchis felineus and clonorchis made by GenomeMatch and NUCmer programs:
| Method | Alignment length | Coverage | Mismatch | Alignment block count |
| Nucmer defaults options | 255590926 (0.4101) | 195911369 (0.3143) | 34893055 (0.0559) | 294674 |
| nucmer maxgap=500 minclust=100 | 262047452 (0.4204) | 246567124 (0.3956) | 41400241 (0.0664) | 170680 |
| GenomeMatch | 398414938 (0.6392) | 398551814 (0.6395) | 57220968 (0.0918) | 136876 |
Visualizing synteny
Alignment filter
align_filter.pl program takes a coords file and filters it according to the following parameters:
| longest | is the longest alignment contig of a target and its related query |
| longest10 | Ten longest contigs of a target and its related query |
| top10gomol | finds ten most homologous contigs in a target and a query |
| top10cov | Ten most covered contigs in a target and a query |
The difference between top10gomol and top10cov is that in top10gomol coverage that gives overlapping blocks isn’t not taken into account, while in top10cov it is.
Example:
./align_filter.pl filter_name coords_alignment_file > coords_filtered_alignment_file
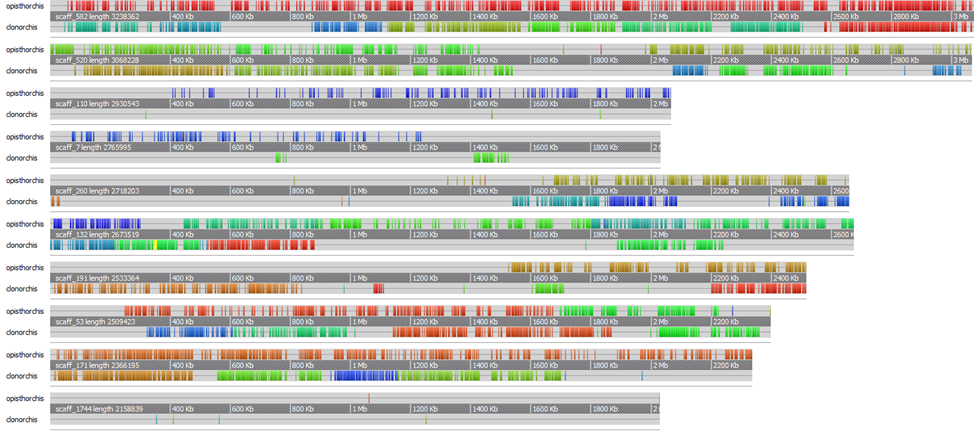
Visualization by Softberry SequenceExplorer
Filtered alignment files can be visualized using the Softberry SequenceExplorer. The viewer takes an xml file as an input. To prepare such file, synteny_viewer.pl script can be used, which takes coords filtered files as an input and outputs xml file for visualization. For example, to visualize ten longest contigs:
./synteny_viewer.pl "opisthorchis;synteny/top10/assembly_vs_opisthorchis-maxgap500minclust100-longest10.txt;direct" "clonorchis;synteny/top10/assembly_vs_clonorchis-maxgap500minclust100-longest10.txt;reverse" > synteny/longest10.xml
Opening longest10.xml file in SequenceExplorer shows the following:
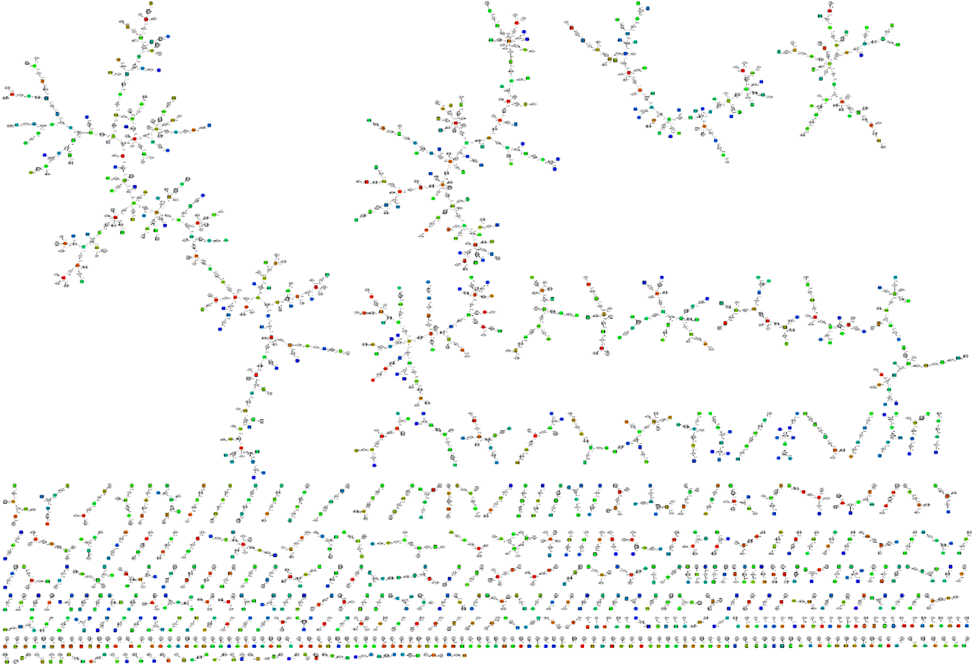
Graphs based visualization
To resolve the problem of visualization of synteny between large sets of genomic fragments, we suggests a method based on reconstruction and visualization of graphs representing a relationships between genomic fragments. The method is based on building a directed, weighted, bipartite graph, the nodes of which are contigs and the weights of edges represent coverage of contig pairwise alignments.
Graph.pl and graphml.pl scripts use genomic alignments in coords format as input. They construct a graph of sequence similarity and generate a graphml file for graphic representation by
yEd viewer:
./graph.pl file.coords > file.graph
./graphml.pl file.graph > file.graphml
Opening graphml_file file in yEd shows the following:
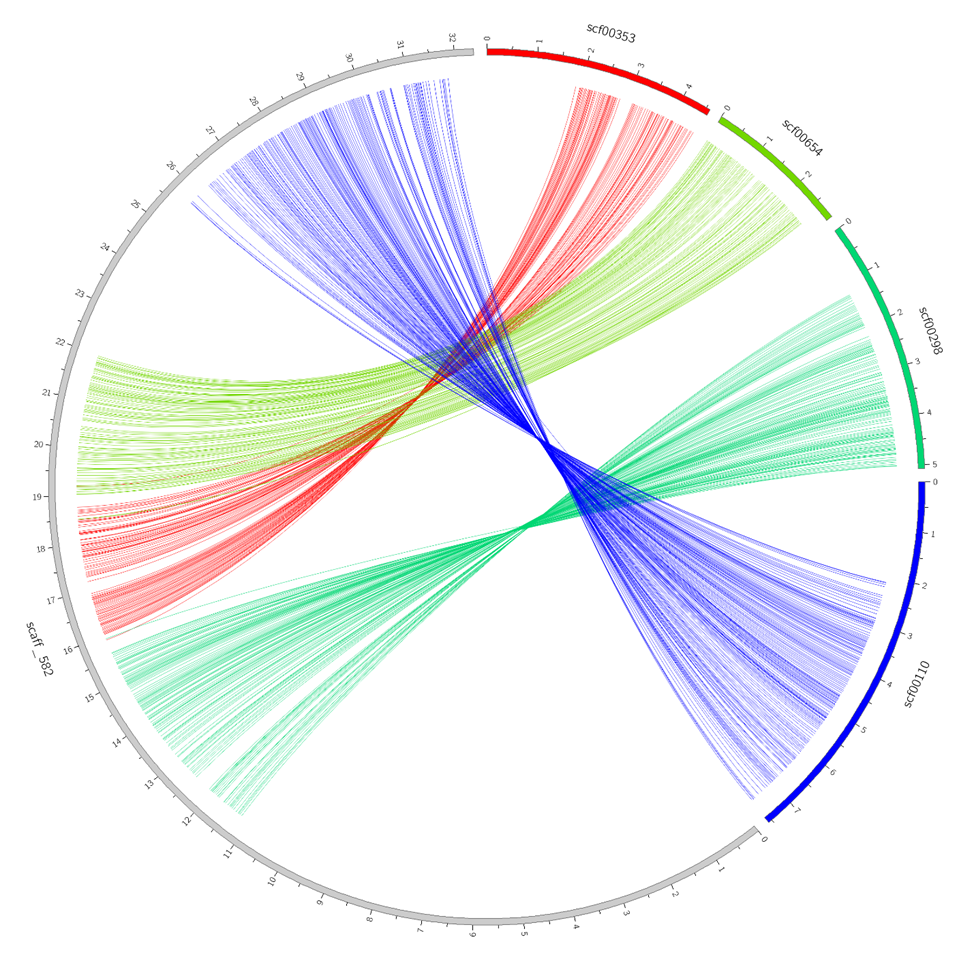
Visualization using Circos charts
Another way to visualize is via Circos pie charts. This method lets users to study in detail relationship between several contigs. Contigs for visualization can be chosen from a graph file. For example, choose four cotings with maximum coverage related scaff_582.
cat file.graph | grep scaff_582 | sort -k3 -r | head -4
The result should be input in a configuration file config.pm of circos.pl script.
%config= (
'TARGET' => 'opisthorchis_viverrini.fa',
'QUERY'  => 'clonorchis_sinensis.fa',
'ALIGN'  => 'opisthorchis_vs_clonorchis.coords',
'DATA'   => '
scaff_582       scf00353        0.053519958546944
scaff_582       scf00654        0.053706781391333
scaff_582       scf00298        0.085199863387725
scaff_582       scf00110        0.119952618021086
',
);
The script would output the following graph: