Services Test Online
Content
1. Introduction
The "MALI viewer" application is developed for aligning amino acids sequences and working with results of such alignments:
- Aligning sequences
- Editing sequences
- Using variable color schemes for residues
- Building tree diagrams (dendrograms) for sequences
- Analyzing main components
2. General system description
2.1. Main window
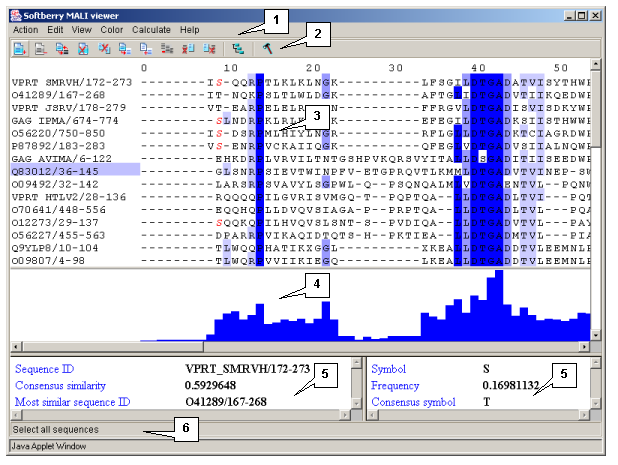
The main window contains (fig. 2.1.1):
- The main menu
- The control panel
- The alignment area
- The alignment's histogram area
- Information bars
- The string of status
2.2. Commands of the main menu
- Action - the group of commands for loading and calculating alignments:
- Input align - opens the "Alignment dialog" box purposed for defining the alignment to be loaded and its format.
- Output align - opens the "Alignment dialog" box purposed for retrieving the currently loaded in this window alignment in selected format.
- Send postscript - opens the "Export postscript file dialog" box purposed for obtaining the postscript file.
- Process alignment - opens the "Load dialog" box purposed for calculating a new alignment.
- Realign all sequences - opens the "Load dialog" box purposed for recurring aligning all sequences.
- Realign selected sequences - opens the "Load dialog" box purposed for aligning the selected sequences.
- Exit - closing the application.
- Edit - the group of commands for editing sequences and their groups:
- Groups� - opens the "Group properties" dialog box purposed for working with groups of sequences.
- Groups editing mode - provides (when enabled) the simultaneous editing all sequences in the same group.
- Select all sequences - makes all sequences selected.
- Deselect all sequences - makes all sequences unselected.
- Invert sequence selection - makes the selection of sequences inverted.
- Delete selected sequences - removes selected sequences.
- Move selected sequences to new alignment - replaces selected sequences to a new window.
- Copy selected sequences to new alignment - creates copies of selected sequences in a new window.
- Deselect all columns - makes all columns unselected.
- Delete selected columns - removes selected columns.
- Remove sequence <- left of selected columns - removes the fragments of sequences to the left of selected columns..
- Remove sequence -> right of selected columns - removes the fragments of sequences to the right of selected columns.
- Set gap character to - allows selecting the symbol for gap: "." or "-".
- Remove gapped columns - removes columns consisting of gaps only.
- View - the group of commands for setting up the image display:
- Options - opens the "Options" dialog box purposed for setting up the visualization of sequences in the main window.
- Quality - shows an alignment as a diagram.
-
Color - the group of commands for setting up the color schemes for applying to residues of alignment . The following color schemes are available in the application (the schemes' description see in chapter 3.3):
- ClustalX colors
- Zappo colorscheme
- Taylor colorscheme
- By hydrophobicity
- Helix propencity
- Strand propencity
- Turn propencity
- Buried index
- By conservation
- Above PID threshold only
- By PID
- By BLOSUM62 score
Calculate - the group of commands for processing the calculations:
- Consensus - calculates a consensus.
- Conservation - calculates the conservatism of sequences. The conservatism is calculated in groups.
- Remove redundancy - removes the sequences with similarities to consensus below the threshold defined.
- Sort - Sequences' sorting modes:
- Sort by pairwise identity - sorts by pairwise identity.
- Sort by ID - sorts by alphabetical order. Sequences' IDs are used for sorting.
- Sort by group ID - sorts by groups first and then by alphabetical order inside a group.
- Sort by tree - sorts sequences by their order on the tree..
- Show tree - opens the "Tree diagram" dialog box purposed for visualization of hierarchic clustering of sequences (the tree of sequences)
- Principal Component Analysis - analysis of main components:
- Calculate - calculates main components.
- PCA 2D proteins - opens the "Protein PCA Diagram 2D" window displaying two-dimensional plot of sequences' principal components.
- PCA 3D proteins - opens the "Protein PCA Diagram 3D" window displaying three-dimensional plot of sequences' principal components.
- PCA 2D residues - opens the "Residue PCA Diagram 2D" window displaying two-dimensional plot of residues' principal components.
- PCA 3D residues - opens the "Residue PCA Diagram 3D" window displaying three-dimensional plot of residues' principal components.
- Calculate all - calculates consensus, conservatism and principal components.
- Help - the group of commands for opening the boxes with information on the application:
- About - opens the "About" dialog box with information on the application.
2.3. Control panel
Functions of control panel buttons:
| Select all sequences - makes all sequences selected. | |
| Deselect all sequences - makes all sequences unselected.� | |
| Inverse sequence selection - makes the selection of sequences inverted. | |
| Delete selected sequences - removes selected sequences (strings). | |
| Delete selected columns - removes selected columns. | |
| Move selected sequences to new alignment - replaces selected sequences to a new alignment window. | |
| Copy selected sequences to new alignment - creates copies of selected sequences in a new alignment window. | |
| Deselect all columns - makes all columns unselected. | |
| Remove sequence <- left of selected columns - removes the fragments of sequences to the left of selected columns. | |
| Remove sequence -> right of selected columns removes the fragments of sequences to the right of selected columns. | |
| Tree - opens the dialog box with tree diagram | |
| Options - opens the configuration dialog box |
2.4. Alignment area
This area is purposed for visualizing and editing sequences of alignment.
Single left mouse button click over a symbol marks this symbol with color and changes its style to italic, and similar symbols that are in the same positions in all sequences are being marked also (see fig. 2.1.1).
To move a fragment of sequence press the "Shift" key, place mouse pointer over a symbol, press the mouse left button and then drag a symbol. If to drag a symbol to the right, then a gap will appear in the original position of symbol and sequence will be displaced in chosen direction. If the "Edit>Groups editing mode" is on, then gap insertion occurs in all sequences of the selected group. If to drag a symbol to the left, then gap symbols will be replaced by the dragging fragment.
2.4.1. Replacing a symbol in a sequence.
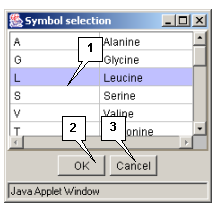
Double left mouse button click over a sequence's symbol opens the "Symbol selection" dialog box (fig. 2.4.1.1). The box contains the list of all symbols and their meaning. The clicked symbol is marked in the list. To replace this symbol with another one select the new symbol in the list and press the "OK" button. The "Symbol selection" dialog box will be closed and the new symbol (letter) will appear in a sequence.
2.5. Area of the alignment histogram
This area is shown if the "View>Quality" command of the main menu is selected.
The histogram represents the internal homogeneity of positions. Histogram represents the internal homogeneity of positions and can be calculated by the following manner: in the column the pairs of residues are checked through and then values for these pairs taken from BLOSUM62 table are summarized [1]. Further all these data are normalized to the maximal among all columns value.
2.6. Information bars
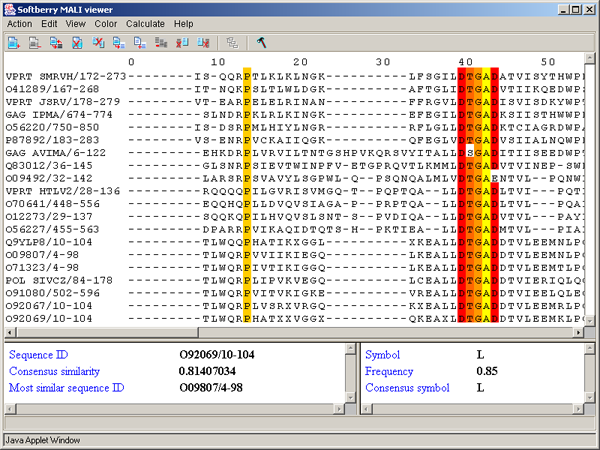
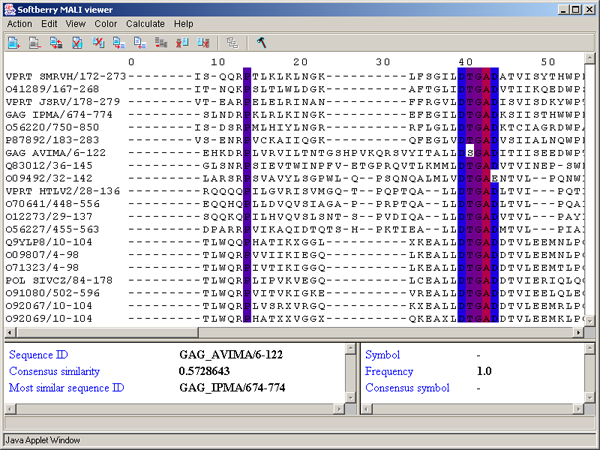
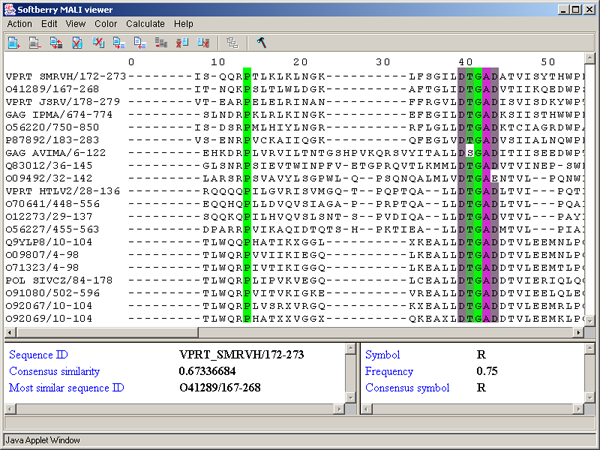
The left information bar (fig. 2.1.1) displays the summary on a sequence, the symbol of which is currently pointed by the mouse: ID, similarity to consensus and the ID of sequence with the most homology to the current one.
The right information bar (fig. 2.1.1) displays the summary on a symbol currently pointed by the mouse: name of a symbol, the rate of occurrence in the given column and the name of a symbol in consensus of current position.
3. Operating the application
3.1. Loading a file, calculating an alignment
Loading an alignment
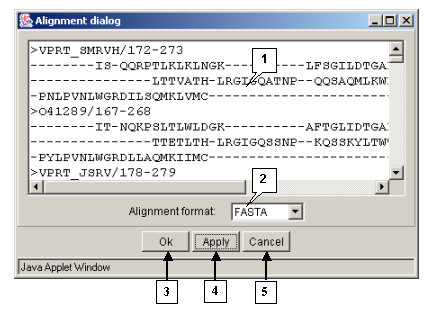
The "Action>Input align" command opens the "Alignment dialog" box purposed for loading an alignment (fig. 3.1.1):
- The entry field for alignment input
- The "Alignment format" list provides the available formats of alignment.
If the wrong format is selected, the loading will not occur.
- The list contains the following formats:
- FASTA
- PIR
- CLUSTAL
- PFAM
- POSTAL
- BLC
- MSF
The "Load in new frame" checkbox. If the box is checked in, the alignment will be loaded in the new window.
The "OK" button is purposed for closing the window and loading an alignment.
The "Apply" button is purposed for loading an alignment without closing the window.
The "Cancel" button is purposed for canceling the loading.
Outputting alignment
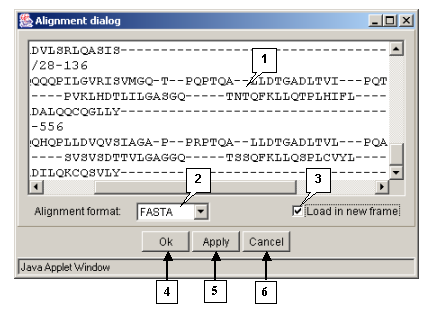
The "Action>Output align" command opens the "Alignment dialog" box purposed for retrieving an alignment in the defined format (fig. 3.1.2).
- The alignment entry field is purposed for inputting an alignment.
- The "Alignment format" list is purposed for defining the format of alignment.
- The list contains the following formats:
- FASTA
- PIR
- CLUSTAL
- PFAM
- POSTAL
- BLC
- MSF
The "OK" button is purposed for closing the window and outputting an alignment.
The "Apply" button is purposed for inputting an alignment from the main window into the alignment entry field in the defined format.
The "Cancel" button is purposed for canceling the alignment outputting.
Downloading an alignment from the server
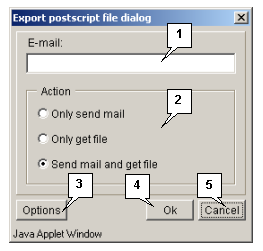
The "Send postscript" command opens the "Export postscript file dialog" box purposed for downloading the post-script file from the server (fig. 3.1.1.1) by the following means:
- Only send e-mail - to send the file with data via e-mail (the address is to be specified in the "E-mail" field).
- Only get file - to download the file.
- Send mail and get file - both to receive the file via e-mail (the address is to be specified in the "E-mail" field) and download it.
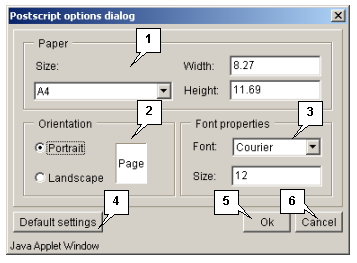
The "Options" button opens the "Postscript options dialog" box (fig. 3.1.1.2) purposed for defining the parameters of data file (size and layout of a page, font).
The "OK" button is purposed for closing the window and applying the selected changes.
The "Cancel" button is purposed for canceling all changes.
Calculating an alignment
- Process alignment - opens the "Load dialog" box purposed for calculating an alignment.
- Realign all sequences - opens the "Load dialog" box purposed for realigning all sequences.
- Realign selected sequences - opens the "Load dialog" box purposed for aligning the selected sequences.
"Load dialog" box
To compare sequences one of two algorithms (or their combination) can be used:
1. An alignment is calculated using a dendrogram;
2. A concurrent performing an alignment and building a similarity dendrogram.
Algorithm 1 and Algorithm 2 can be used in combination. In the beginning of analysis it is more effective to use Algorithm 1, while at the following steps - Algorithm 2.
For taken sequences using the sequences similarity measure the matrix of pair similarity is being calculated. The pair of sequences with maximal similarity is being selected. The appropriate sequences are being removed from the total pool and instead of them the "object" consisting of these two sequences (profile of the pair alignment) is being added. Combining these two sequences is the first knot of dendrogram. The remained pool (its size is reduced by 1) is being used for calculating the matrix on the basis of sequences similarity measure and the process is being repeated. The similarity of the matrix's objects every time is being calculated anew. This algorithm provides more precise results but is time consuming. Each iteration reduces the size of a matrix by 1. The total number of iterations in this algorithm is equal to n-1, where n - the original size of a pool. Every next iteration provides the new dendrogram's knot, and in the end of aligning we have the one sequence, which represents the profile of aligning of all sequences from the original pool (multiple alignment) , and a dendrogram, which represents the joining order of this sequences.
Algorithm 1 (ordered by dendrogram).
A dendrogram can be either taken from a file or built with use of one of matrix clustering methods (UPGMA, WPGMA, NN, FN).
It is known that for these methods only the table of pair similarity of objects is required. Applying the sequences similarity measure serially to all pairs the required matrix (as for algorithm 2) can be obtained. Further, using the selected clustering method the dendrogram can be built.
The sequences similarity measures for algorithms 1 and 2 may differ.
As the similarity measure the following ones may serve:
- In the case of alignment the following measures can be:
- The sum of alignment blocks' scores
- The score of alignment representing the probability of its appearance by occasional reasons.
- The score of the best block of alignment.
- The total score of alignment including penalties for gaps etc.
- In the case of no alignment the following measures can be:
- The maximal number of common L-plets.
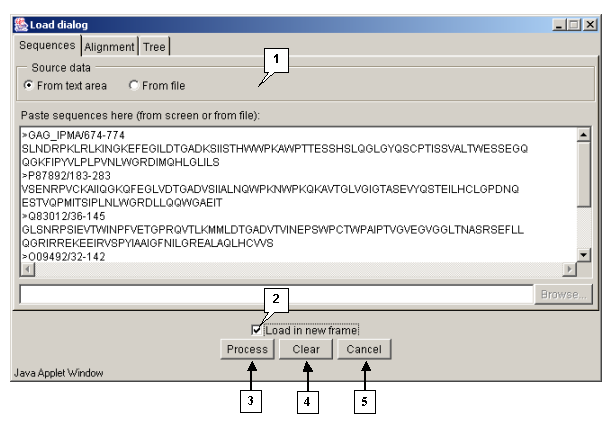
Tab "Sequences"
The "Sequences" tab (fig. 3.1.1.3) is purposed for loading sequences to be aligned. The "Source data" panel is purposed for selecting the source of data to be loaded:
- "From text area" - sequences are to be taken from the text field.
- "From file" - sequences are to be taken from a file.
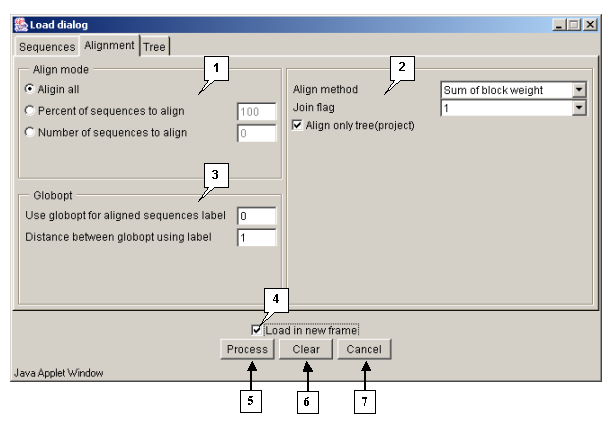
Tab "Alignment"
The "Alignment" tab is purposed for defining the parameters of alignment processing.
The "Align mode" panel is purposed for selecting the algorithm of aligning:
- "Align all" - to use the algorithm 1 only.
- "Percent of sequences to align" - to align N percents of sequences using the algorithm 1, and all remaining with use of the algorithm 2.
- "Number of sequences to align" - to align N sequences using the algorithm 1, and all remaining with use of the algorithm 2.
The panel of alignment options contains:
- The "Align method" list, purposed for selecting the sequences similarity measure to be used in algorithm 2:
- Alignment score - The score of alignment representing the probability of its appearance by occasional reasons.
- Sum of block weight - The sum of alignment blocks' scores.
- Maximum of block weight (weight of best block of alignment) - The score of the best block of alignment.
- Total alignment weight - The total score of alignment including penalties for gaps etc.
- The "Join flag" checkbox. If the box is checked in, the unaligned flanks are to be added to alignment, otherwise - are not.
- The "Align only tree (project)" option. If the option is selected, then only sets of sequences selected in a project are to be compared. At this the certain number of single alignments can be obtained.
The "Globopt" panel is purposed for defining the following parameters:
- Use globopt for aligned sequences label - n\a
- Distance between globopt using label - The frequency of global alignment optimization (i.e. how often the optimization of the internal gap's localization will occur). If the "0" value is defined in the field, the option is not in use.
Tab "Tree"
The "Tree" tab is purposed for defining the parameters of a dendrogram processing.
The "Method of matrix evaluation" list contains the sequences similarity measures to be used for building a dendrogram:
- Number of common L-plets - The maximal number of common L-plets.
- Sum of alignment blocks weights - The sum of alignment blocks' scores
- Aligmnetn score - The score of alignment representing the probability of its appearance by occasional reasons.
- Weight of best block of alignment - The score of the best block of alignment.
- Total alignment weight - The total score of alignment including penalties for gaps etc.
The "Build tree using method" list contains the methods to be used for joining the knots of a dendrogram:
- UPGMA
- WPGMA
- Nearest Neighbours
- Furthest Neighbours
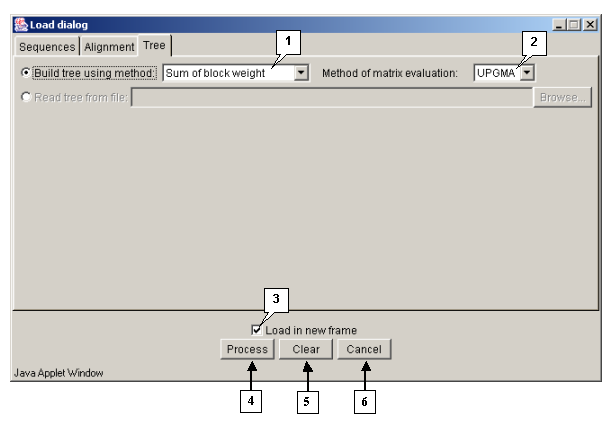
Operating the "Load dialog" box:
- The "Load in new frame" checkbox. If the box is checked in, the alignment is being loaded in a new window, otherwise - in the current one.
- The "Process" button is purposed for closing the window and starting the processing of alignment.
- The "Clear" button is purposed for restoring the default window's settings.
- The "Cancel" button is purposed for closing the window and refusing the calculations.
3.2. Editing
Editing can be performed with use of the "Edit" commands' group and with use of the mouse in the alignment area.
3.2.1. Editing the groups of sequences
The "Edit>Group" command opens the "Group properties" dialog box purposed for editing the groups of sequences (fig. 3.2.1.1).
The list of groups
The list of groups contains the identifiers of groups and information on a number of sequences in a group.
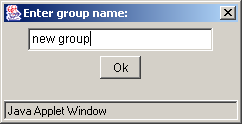
The "Add new group" button is purposed for adding a new group to the list. On pressing the button the "Enter group name" dialog box appears (3.2.1.2). Define the name of a group in this box and press the "OK" button.
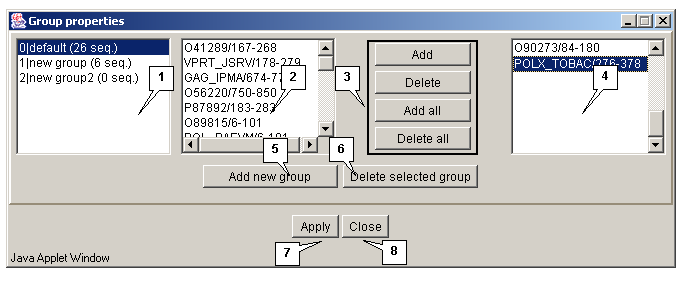
The "Delete selected group" button is purposed for removing the selected groups from the list.
Comment. By default, the list always contains the single group with the name "default" that originally (i.e. before editing) includes all sequences of the loaded alignment.
Lists of sequences
To edit a group select it in the list. In the list 1 the identifiers of sequences included in this group will be displayed. The list 2 contains the identifiers of sequences not included in any of the groups.
The "Add", "Delete", "Add all" and "Delete all" buttons are purposed for operating the lists 1 and 2.
Buttons for operating the "Group properties" box:
- Apply - to apply all made changes.
- Close - to close the window without applying any made changes.
3.2.2. Editing sequences.
Substituting a symbol and inserting a gap in the sequence are described in chapter 2.4.
Selecting, deleting, copying and relocating can be performed using the "Edit" group's commands of the application's main menu.
3.3. Color schemes
The application provides the possibility to apply different color schemes to the symbols of residues. Selecting a color scheme can be performed using the "Color" group's commands of the main menu. The coloring may occur either for the symbol of residue or for its background (it depends on settings defined in the "Options" dialog box, see chapter 3.5).
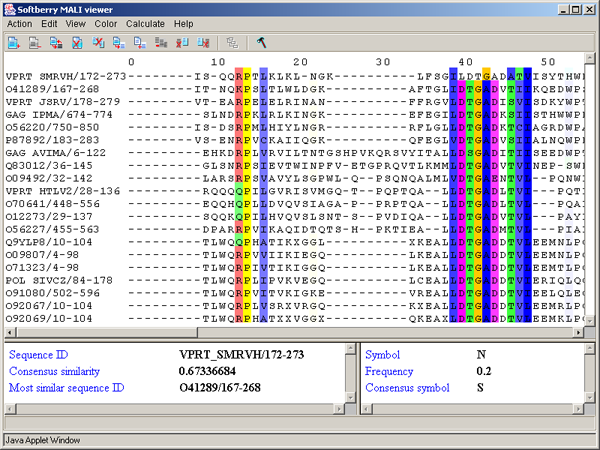
ClustalX colors - ClustalX colors - The color scheme used in the "ClustalX" application [2]. The color of a symbol depends on residue type and on frequency of its occurrence in the column (see fig. 3.3.1, tab. 3.3.1).
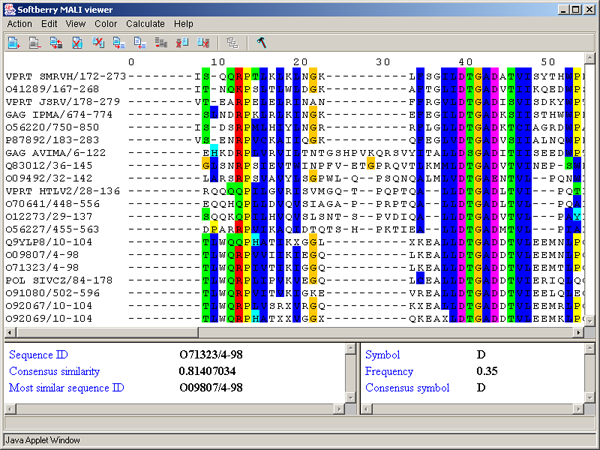
Table 3.3.1.
| Residue type | Conservatism | Color |
| Hydrophobic (ACFHILMVWY) | >60% | BLUE |
| With negative charge (DE) | >50% | MAGENTA |
| With positive charge (KR) | >60% | RED |
| Polar (STQN) | >50% | GREEN |
| Cysteines | >85% | PINK |
| Glycines | >85% | ORANGE |
| Prolines | >85% | YELLOW |
| Aromatic (FYW) | >50% | hydrophobic CYAN |
Zappo colorscheme - aminoacidic residues are colored in accordance to their physicochemical properties (see fig.3.3.2, table 3.3.2).
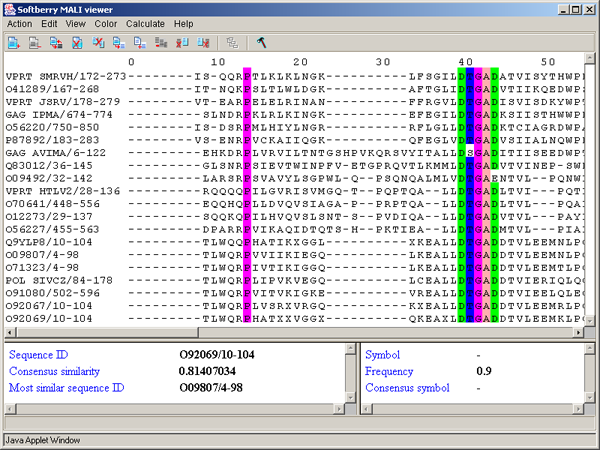
Table 3.3.3.
| Residues | Description | Color |
| ILVAM | Aliphatic/Hydrophobic | Pink |
| FWY | Aromatic | Orange |
| KRH | With positive charge | Red |
| DE | With negative charge | Green |
| STNQ | Hydrophilic | Mid blue |
| PG | Proline/Glycine (conformationnaly special) | Magenta |
| C | Cysteine | Yellow |
Taylor colorscheme - Taylor colorscheme - aminoacidic residues are colored in accordance to the scheme provided by Taylor [3] (fig. 3.3.3).
By hydrophobicity - aminoacidic residues are colored in accordance to the table of hydrophobicity by [4]. According to the table the most hydrophobic residues are colored in red, the most hydrophilic ones - in blue. Colors of residues with intermediate properties are the halftones of purple, which depend on the scale value (fig. 3.3.4).
Helix propensity - preferring formation of the a-helix (fig. 3.3.5) [5].
Strand propencity - preferring formation of the b-folds (fig. 3.3.6) [5].
Turn propencity - preferring formation of the bending (fig. 3.3.7) [5].
Buried index - in accordance to the frequency of occurrence inside a globule (fig. 3.3.8).
By conservation - it changes the color's intensity of used color scheme in dependence on conservatism [6, 7]. The conservatism can be assigned with use of numbers 0 to 9 and a symbol "*". The number defines the number of characteristics that are to be similar for properties of aminoacids in the column of alignment. The "*" symbol means that the set of aminoacidic residues has the similar properties for all characteristics in consideration. For "*" the color cannot be changed. As for numbers, the lesser the number, the lighter the color. In figure 3.3.9 the result of serial using of "ClustalX colors" and "By conservation" schemes is shown.
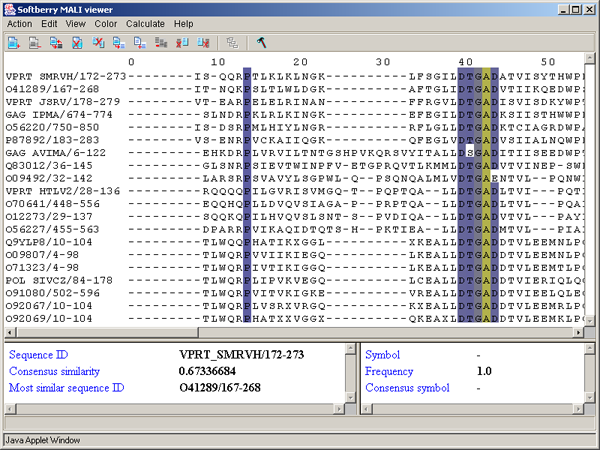
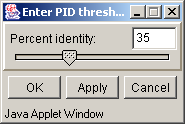
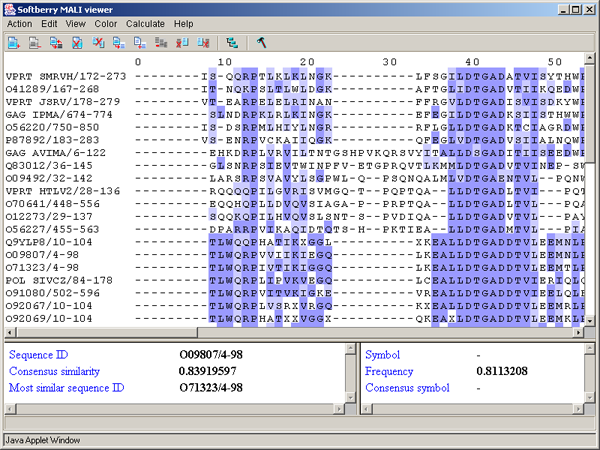
Above PID threshold only - the chosen color scheme (Zappo coloscheme, Taylor coloscheme or By hydrophobicity) is to be applied only to those aminoacidic residues, percentage of which in the current column exceeds the threshold value (fig. 3.3.10). This command opens the "Enter PID threshold" dialog box (fig. 3.3.11), where the user should define the threshold value and then press the "OK" or "Apply" button.
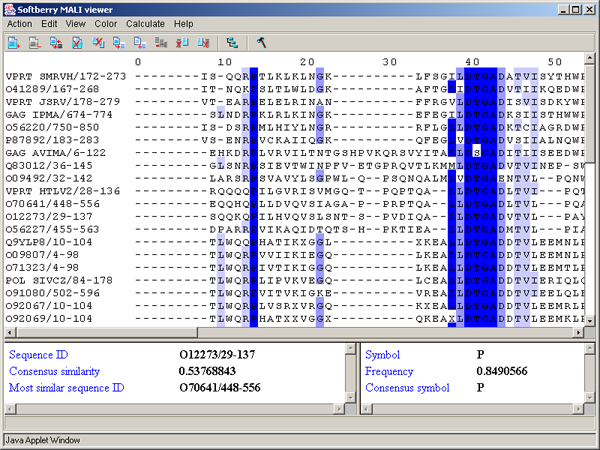
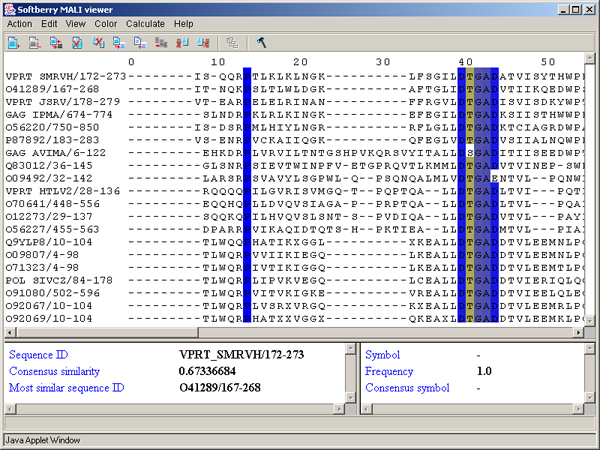
By PID - aminoacidic residues are colored in accordance to the rate of occurrence of a symbol in the column (see table 3.3.4, fig. 3.3.12). This scheme is used by default.
������� 3.3.4.
| Percent | Color |
| > 80 % | Mid blue |
| > 60 % | Light blue |
| > 40 % | Light grey |
| <= 40% | White |
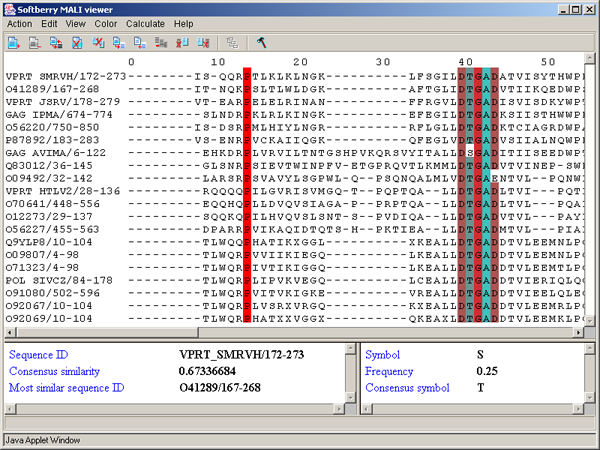
By BLOSUM62 score - aminoacidic residues are colored in accordance to their score in the column, which is determined accordingly to the BLOSUM62 matrix [1] (fig. 3.3.13). The symbol with maximal score is colored in blue. If the score of a symbol is positive when compared to the maximal one, it is colored in light blue, in all other cases the symbol is colored in white.
3.4. Performing the calculations.
Performing the calculations and sorting as well as opening the dialog boxes of tree's diagram and principal components' plots can be completed with use of the "Calculate" commands' group of the main menu:
- Consensus - to calculate the consensus for the set of sequences that are in the display area.
- Conservation - to calculate the conservatism of sequences. The conservatism is calculated in groups.
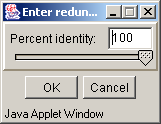
- Remove redundancy - to remove the sequences with similarities to the consensus below the defined threshold value. On executing this command the "Enter redundancy�" dialog box (fig. 3.4.1) with "Percent identity" entry field, where the appropriate value should be defined, appears. After completing the entry press the "OK" button.
- Sort - sequences' sorting modes:
- Sort by pairwise identity - to sort by identity in pairs
- Sort by ID - to sort in alphabetical order
- Sort by group ID - to sort by groups first and then by alphabetical order in groups.
- Sort by tree - to sort sequences by their order in a tree.
- Show tree - opens the "Tree diagram" dialog box (see chapter 3.4.1) purposed for visualization of the hierarchical clustering of sequences (dendrogram).
- Principal Component Analysis - to perform the calculating and visualizing the principal (main) components (see chapter 3.4.2).
- Calculate all - to calculate the consensus, the conservatism and the main (principal) components.
3.4.1. Tree diagram
The "Tree Diagram" dialog box (fig. 3.4.1.1) is purposed for visualizing the tree of sequences. The box can be opened using:
- The "Calculate>Show tree" command of the main menu
- The
 button of the control panel
The window contains:
- The main menu;
- The diagram visualization area.
Main menu commands
- "Action" - contains the following commands:
- Show scalable tree diagram - opens the scaleable diagram's dialog box.
- Send postscript - opens the "Export postscript file dialog" box purposed for downloading the postscript file from the server (see chapter 3.1).
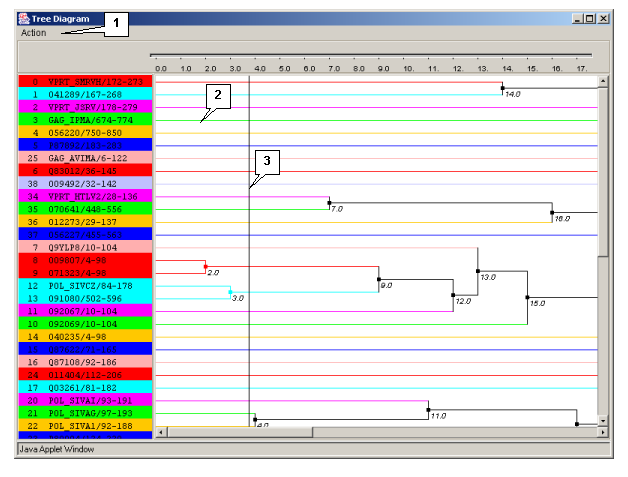
Diagram's visualization area
Clicking the mouse left button on a diagram causes the navigation line to be moved.
Clicking the mouse left button on a knot leads to, in the case when there are no daughter knots, reordering of the leaves in reverse order, otherwise it causes the same reordering of the daughter knots.
Clicking the mouse left button on a diagram defines the maximal distance between any two sequences in the group The different clusters are marked with different colors both on the tree diagram, and in the main window of the application.
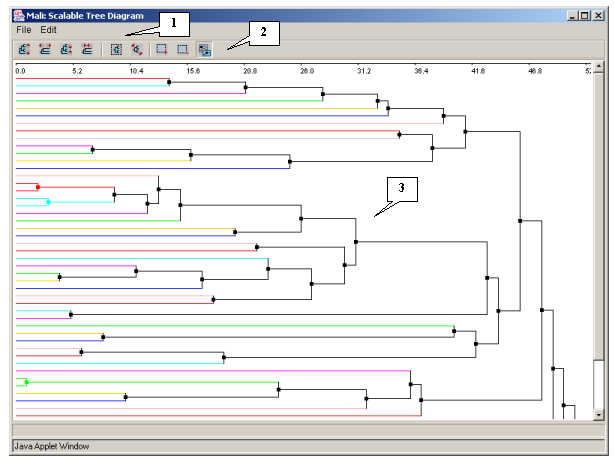
3.4.1.1. The dialog box of the scalable diagram
The "Scalable Tree Diagram" dialog box (fig. 3.4.1.1.1) can be opened with use of the "Action>Show scalable tree diagram" command of the "Tree Diagram" window's main menu. It contains:
- The main menu
- The control panel
- The area of diagram's visualization and scaling
Commands of the main menu and functions of the control panel's buttons
"File" - provides the set of commands for operating the files:
- "Close" - to close the dialog box.
"Edit" - provides the set of commands for changing the scale of images:
- "Zoom in vertical" (the
 button) - to expand the image vertically.
 - "Zoom in horizontal" (the
 button) - to expand the image horizontally.
 - "Zoom out vertical" (the
 button) - to condense the image vertically.
 - "Zoom out horizontal" (the
 button) - to condense the image horizontally.
 - "Zoom 100%" (the
 button) - to restore the original size of the image.
 - "Zoom min" (the
 button) - to set the minimal scaling of the image.
 - "Zoom in" (the
 button) - to expand the selected part of the image.
 - "Zoom out" (the
 button) - to condense the selected part of the image.
 - "Go to" (the
 button) - to select a knot for visualizing on the main diagram.
3.4.2. Principal components.
Calculating and visualizing the main components can be completed using the "Calculate>Principal Component Analysis" commands' group of the main menu.
Calculating the components.
The "Calculate>Principal Component Analysis>Calculate" command is purposed for calculating the main components. During the calculations appears the information windows, which disappears on calculations are finished (fig. 3.4.2.1).
Visualizing the main components.
- The application provides the possibility to visualize the main (principal) components of sequences and aminoacidic residues both in 2D and 3D space. Plots can be opened with use of the following commands of the application's main menu:
- PCA 2D proteins - opens the "Protein PCA Diagram 2D" window showing the 2D plot of the sequence's main components.
- PCA 3D proteins - opens the "Protein PCA Diagram 3D" window showing the 3D plot of the sequence's main components.
- PCA 2D residues - opens the "Residue PCA Diagram 2D" window showing the 2D plot of the residues' main components.
- PCA 3D residues - opens the "Residue PCA Diagram 3D" (see fig. 3.4.2.2) window showing the 3D plot of the residues' main components.
The composition and functions of these four windows are similar.
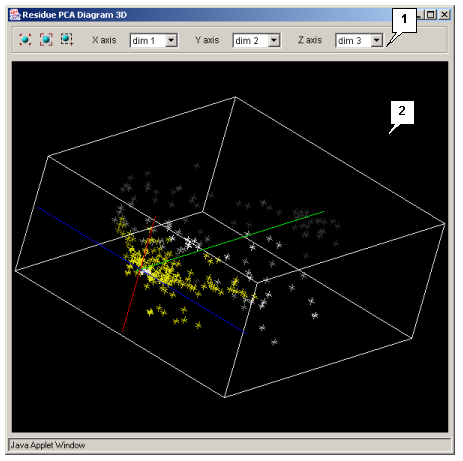
The control panel contains:
- The
 button returns the plot in the originally loaded position.
 - The
 button scales the image into the plot's visualization area (for 3D plots only).
 - The
 button switches selection mode on.
 - The X axis list allows selecting the X axis components.
- The Y axis list allows selecting the Y axis components.
- The Z axis list allows selecting the Z axis components (for 3D plots only).
The plot visualization area allows:
Zooming image in and out. To perform this operation use the mouse pointer while the "Shift" button is pressed. Moving the pointer up zooms the image out, moving it down zooms the image in.
Moving the image. To perform this operation use the mouse pointer while the "Ctrl" button is pressed.
Rotating the image (for 3D plots only). To perform this operation use the mouse pointer.
Selection is to be made by the mouse left button. Selection mode runs on by the ![]() button. Identifiers of sequences selected in the plot area are automatically selected in the sequences area of the main window and vice versa. Aminoacidic residues selected in the plot area are automatically selected in the sequences area of the main window and vice versa.
button. Identifiers of sequences selected in the plot area are automatically selected in the sequences area of the main window and vice versa. Aminoacidic residues selected in the plot area are automatically selected in the sequences area of the main window and vice versa.
The axis of yellow color on the 2D plots is auxiliary, the user can turn this axis in any direction by mouse.
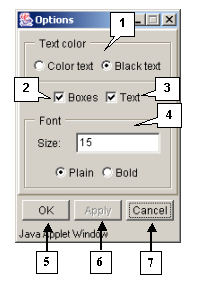
3.5. Options dialog box
The "Options" dialog box (fig. 3.5.1) is purposed for setting up the sequences visualization. This box can be opened using:
- The "View>Options" command of the main menu;
- The
 button of the control panel.
The "Text color" panel allows the color of symbols to be set up:
- Color text - for colored symbols. The color of symbols depends on applied color scheme. The color scheme can be selected using the "Color" group of commands.
- Black text - for black symbols.
The "Boxes" checkbox. If the box is checked in, the color background of residue is shown. The background color depends on applied color scheme. The color scheme can be selected using the "Color" group of commands.
The "Text" checkbox. If the box is checked in, the residue symbols are shown.
The "Font" panel is purposed for setting up the font for residues:
- The "Size" field is used for setting up the size of font.
- The "Plain" option - for normal font.
- The "Bold" option - for bold font.
The button "OK" is purposed for closing the box and applying the selected options, the button "Apply" - for applying the selected options before closing the box, the button "Cancel" - for closing the box and rejecting the selected options.
Literature
1. Henikoff, S. and Henikoff, J. G. (1992). Amino acid substitution matrices from protein blocks. Proc. Natl. Acad. Sci. USA 89: 10915-10919.
2. Thompson, J.D., Higgins, D.G. and Gibson, T.J. (1994) CLUSTAL W: improving the sensitivity of progressive multiple sequence alignment through sequence weighting, positions-specific gap penalties and weight matrix choice. Nucleic Acids Research, 22:4673-4680.
3. Taylor WR. (1997) Residual colours: a proposal for aminochromography. Protein Eng.,10,743-746
4. Kyte J, Doolittle RF. (1982) A simple method for displaying the hydropathic character of a protein. J Mol Biol.,157,105-132.
5. Levitt M. (1978) Conformational preferences of amino acids in globular proteins.Biochemistry,17,4277-4285.
6. Livingstone, C. D. and Barton. G. J. (1993), CABIOS 9, 745-756.
7. Zvelebil, M. J. J. M. et al (1987), J. Mol. Biol., 195 957-961.