Services Test Online
ReadsMap: Program For Mapping Short Sequencing Reads
QUICK START
DESCRIPTION
COMMANDS AND OPTIONS
CONFIGURATION PARAMETRS
PRELIMINARY DATA PROCESSING
ACCURACY
LICENSE AND CITATION
|
|
DESCRIPTION
ReadsMap
is a program for high accuracy mapping of large sets of short sequencing reads.
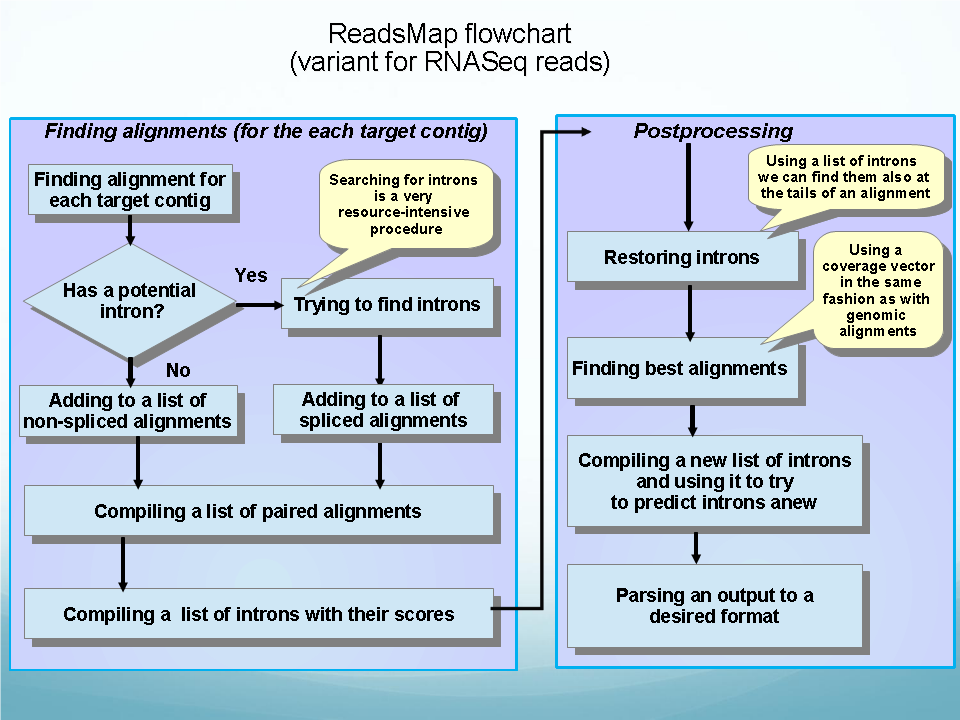
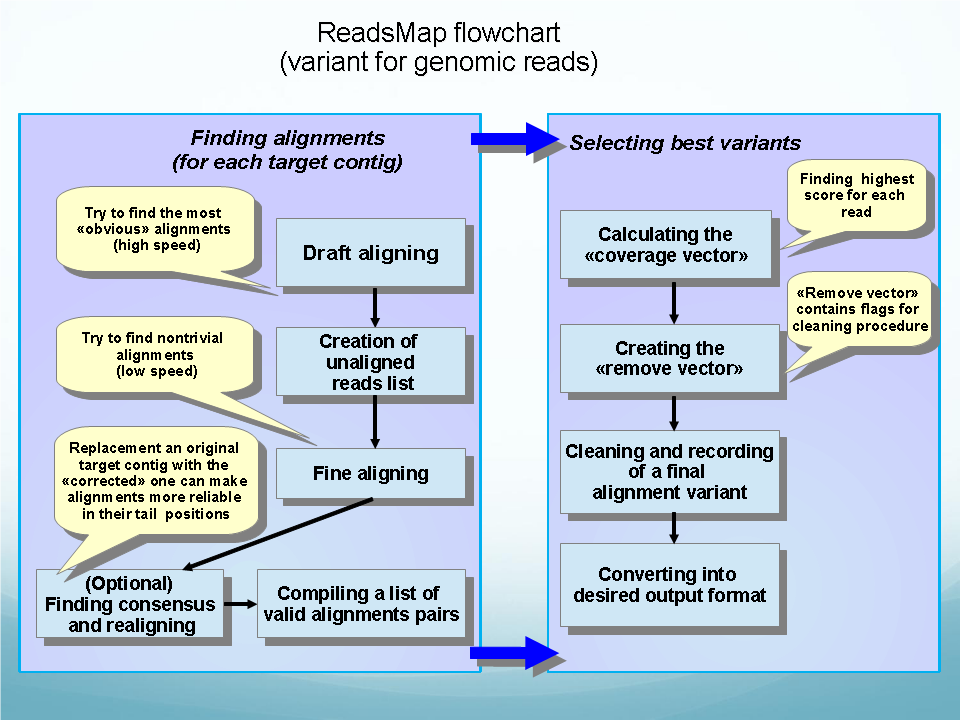
The program can be used for genome and RNA-Seq reads alignments.
ReadsMap is a fast short read aligner that quickly maps/aligns large sets of short DNA sequences. Multiple processors can be used optionally to achieve greater alignment speed. On initial stage we map "exonic" reads that demonstrate high-quality, non-interrupted alignment to a genomic sequence. Potentially, this step would map most of the reads to a genome, and the remaining "non-mapped" group would be small enough to be subjected to more thorough analysis. At the second step, we use a modified variant of our EST_MAP program to align these "non-mapped" reads using splice site matrices and producing very accurate alignment with gaps. This reads will indentify potential exon-intron boundaries.
QUICK START
In the following example of a command line, single-end RNA-Seq reads (file reads.fa) are being mapped to chromosomes (chr1.fa,chr2.fa) of the same organism, allowing for deletions/insertions of up to 4 nucleotides. The results are being saved in subfolder ./da in sam format.
./bin/runReadsMap.pl --chr:chr1.fa,chr2.fa --reads:reads.fa --max_indel:4 --spliced --wrkpath:./da --sam
In this example of a command line, pair-ends genomic reads (file reads.fa) are being mapped to chromosomes (chr1.fa,chr2.fa) of the same organism, allowing for deletions/insertions of up to four nucleotides. Results are being saved in subfolder ./da in sam format. Average distance between external ends of a pair is 200, standard deviation of such distance 20.0.
./bin/runReadsMap.pl --chr:chr1.fa,chr2.fa --reads:reads.fa --paired --max_indel:4 --nosplice --wrkpath:./da -–sam --peAv:200 –peSd:20
COMMANDS AND OPTIONS
Input parametrs:
--chr: - list of chromosomes (contigs), comma separated. File format – FASTA.

 --chr_list: - File with list of names of files with chromosomes (contigs) (alternative to previous variant).
List of filenames is separated by line feed (by one filename in the line).

 --reads: - File with reads. File format - MULTI FASTA.
 --masked - invoke masking (ignore lowercase letters).

 --wrkpath:path - Path to keep aligning results

 --paired - use the information on pairness of reads. In our tests, taking pairness into account increased the specificity (proportion of correct alignments) but, in some way, decreased sensitivity (ratio of correct alignments to total number of reads). By default, this parameter is disabled.
 Paired reads must be in a sequential order (even/odd).
Parameters of paired reads:
 --peAv:X          Average distance between external ends of a pair for PE type pairs. ( default 200.0)

 --peSd:X          Standard deviation of such distance. ( default 20.0)

 --sigma:          Number of standard deviations to calculate maximum and minimum allowed distances. ( default 5.0)
Alignment parametrs:
 --max_indel:X Set the maximal length of deletions/insertions.

 --covSkew:X  Maximal deviation from the best coverage: alignments with quality not worse than 1-X of the best will be kept (will pass the filter).
Output options:
 --cvt - Convert previously calculated *.da files into desired output format (alignment is not performed, only conversion).

 --sam  - convert the result to SAM format.

 --sbl  - convert the result to Sbl-like format (text format of alignment).

 --map  - convert the result into file with mapping coordinates.

 --stat:fname - create file with some descriptive statistics.

 --sites   - create  *sites files for FGENESH.

 --j:x    - number of threads to use during the alignments calculation.
CONFIGURATION PARAMETRS
In the run_align.conf file you can change the default settings for some parameters
NTHREADS    7  - number of threads to use during the alignments calculation.
@MAXINDEL    4 - maximal length of isertions/deletions.
@COVSKEW  0.01 - maximal deviation from best coverage.

@USE_SAMTOOLS 1   - Use samtools to generate VCF file.
@SAMTOOLS $BIN/external/samtools   - set path to samtools ($BIN is ReadsMap folder)
@BCFTOOLS $BIN/external/bcftools  - set path to bcftools ($BIN is ReadsMap

# This variant is valid for version 1.2
@SAMTOOLS_VCF_CMD  mpileup -Bguf    - command line for samtools
@BCFTOOLS_VCF_CMD  call -cv -       - command line for bcftools
PRELIMINARY DATA PROCESSING
File(s) with chromosomal sequence in FASTA format and a file with read sequences in MULTIFASTA format are used as input.
Sequences of paired reads must be in order (even/odd). Preliminary data preparation can be performed using fastq2_2_fasta.pl script, as described in fastq2_2_fasta.txt file.
MAPPING ACCURACY
Table 1. Specification of sets of test reads.
MRNA-simulated reads
Potentially spliced high homology reads, no insertions/deletions, simulates errors of Illumna sequencer.
| Length of reads | Number of reads | Spliced reads (crossing exon junctions) | Parameters of readss |
| 50bp | 2 979 624 | 492 743 (16.5%) | insert size = 200 bp, standard deviation = 20 bp, coverage = 40 |
| 76bp | 1 960 300 | 485 857 (24.8%) | insert size = 200 bp, standard deviation = 20 bp, coverage = 40 |
| 100bp | 1 489 796 | 469 319 (33.3%) | insert size = 300 bp, standard deviation = 30 bp, coverage = 40 |
Table 2. Specification of sets of test reads.
Genome-simulated reads
Non-spliced reads with increasing frequency of mismatches (mutations) and limited number of insertions/deletions of uo tp 4 bp.
| Length of reads | Number of reads | % of mutations | % InDel | Parameters of reads |
| 76bp | 18 363 068 | 0.5 | 0.002 | insert size = 200 bp, standard deviation = 20 bp, coverage = 40 |
| 76bp | 18 363 276 | 1 | 0.02 | insert size = 200 bp, standard deviation = 20 bp, coverage = 40 |
| 76bp | 18 368 502 | 2 | 0.02 | insert size = 200 bp, standard deviation = 20 bp, coverage = 40 |
| 76bp | 18361496 | 3 | 0.02 | insert size = 200 bp, standard deviation = 20 bp, coverage = 40 |
| 76bp | 18365644 | 4 | 0.02 | insert size = 200 bp, standard deviation = 20 bp, coverage = 40 |
| 76bp | 18361920 | 5 | 0.02 | insert size = 200 bp, standard deviation = 20 bp, coverage = 40 |
| 76bp | 18364062 | 6 | 0.02 | insert size = 200 bp, standard deviation = 20 bp, coverage = 40 |
| 76bp | 18369140 | 7 | 0.02 | insert size = 200 bp, standard deviation = 20 bp, coverage = 40 |
| 76bp | 18367384 | 8 | 0.02 | insert size = 200 bp, standard deviation = 20 bp, coverage = 40 |
| 76bp | 18373472 | 9 | 0.02 | insert size = 200 bp, standard deviation = 20 bp, coverage = 40 |
| 76bp | 18371406 | 10 | 0.02 | insert size = 200 bp, standard deviation = 20 bp, coverage = 40 |
Table 3. Combined table of accuracies of four read mapping programs, RNA-Seq reads, both spliced and non-spliced.
Sn = good_align/reads_count.
Sp = good_align/AllAlign.
| 50bp | 76bp | 100bp | ||||
| Sp | Sn | Sp | Sn | Sp | Sn | |
| ReadsMap | 0.95571 | 0.99725 | 0.96732 | 0.99759 | 0.97411 | 0.99680 |
| TopHat | 0.92268 | 0.92268 | 0.94996 | 0.98643 | 0.95528 | 0.91894 |
| STAR | 0.89171 | 0.94056 | 0.90403 | 0.94007 | 0.89864 | 0.93096 |
| PASS | 0.89005 | 0.91547 | 0.88750 | 0.90603 | 0.86458 | 0.87765 |
Table 4. Reads without introduced mutations and insertions/deletions (unspliced reads from the previous set)
ReadsMap v 1.9.0 (version for genomic reads)
| Length, bp | Quantity | Aligned
(Percent) |
Align N | Good | Sp | Sn | F1-Score | G-Measure | Time,sec |
| 100 | 1 020 477 | 1020477 (1.00000) |
1020477 (1.0000) |
1020424 | 0,96978 | 0,99995 | 0,98463 | 0,98475 | 548.03 |
| 76 | 1 473 886 | 1473886 (1.0000) |
1530231 | 1473831 | 0,96314 | 0,99996 | 0,98120 | 0,98138 | 452.56 |
| 50 | 2 486 387 | 2486336 (0.99998) |
2711089 | 2485726 | 0,91687 | 0,99973 | 0,95651 | 0,95740 | 980.28 |
BWA v 0.7.12
| Length, bp | Quantity | Aligned (Percent) |
Align N | Good | Sp | Sn | F1-Score | G-Measure | Time,sec* |
| 100 | 1 020 477 | 1019620 (0.99916) |
1019620 | 1009030 | 0,98961 | 0,98878 | 0,98919 | 0,98919 | 347.29 |
| 76 | 1 473 886 | 1473210 (0.99954) |
1473210 | 1455150 | 0,98774 | 0,98729 | 0,98751 | 0,98751 | 322.25 |
| 50 | 2 486 387 | 2485349 (0.99958) |
2485349 | 2441869 | 0,98251 | 0,98210 | 0,98230 | 0,98230 | 297.23 |
* Time without indexing of reference genome, which took additional 65 sec.
Bowtie
| Length, bp | Quantity | Aligned (Percent) |
Align N | Good | Sp | Sn | F1-Score | G-Measure | Time,sec* |
| 100 | 1 020 477 | 1020244 (0.99977) |
1020244 | 1009052 | 0,98903 | 0,98880 | 0,98891 | 0,98891 | 179.26 | 76 | 1 473 886 | 1473158 (0.99951) |
1473158 | 1454956 | 0,98764 | 0,98716 | 0,98740 | 0,98740 | 156.86 | 50 | 2 486 387 | 2477883 (0.99658) |
2477883 | 2434210 | 0,98237 | 0,97901 | 0,98069 | 0,98069 | 158.74 |
Table 5. Reads with introduced mismatches (mutations) and insertions/deletions of up to four bp
ReadsMap v 1.9.0 (version for genomic reads)
| % of mutations | Quantity | Aligned (Percent) |
Align N | Good | Sp | Sn | F1-Score | G-Measure | Time,sec* |
| 0,5 | 18 363 068 | 18362950
(0,99999) |
19254664 | 18338766 | 0,95243 | 0.99868 | 0.97501 | 0.97528 | 13208,16 |
| 1 | 18 363 276 | 18234432 (0,99298) |
19120356 | 17004096 | 0,88932 | 0.92598 | 0.90728 | 0.90746 | 17901,33 |
| 2 | 18 368 502 | 18242134 (0,99312) |
19142304 | 14515623 | 0,75830 | 0.79025 | 0.77395 | 0.77411 | 29625,92 |
| 3 | 18 361 496 | 18216744 (0,99212) |
19124318 | 15170384 | 0,79325 | 0.82621 | 0.80939 | 0.80956 | 39638,09 |
| 4 | 18 365 644 | 18150184 (0,98827) |
19058762 | 12310677 | 0,64593 | 0.67031 | 0.65789 | 0.65801 | 45485,20 |
| 5 | 18 361 920 | 17985918 (0,97952) |
18886312 | 12444053 | 0,65889 | 0.67771 | 0.66817 | 0.66823 | 46113,67 |
| 6 | 18 364 062 | 17672136 (0,96232) |
18581674 | 11741815 | 0,63190 | 0.63939 | 0.63562 | 0.63563 | 43155,83 |
| 7 | 18 369 140 | 17148746 (0,93356) |
18017920 | 11163611 | 0,61958 | 0.60774 | 0.61360 | 0.61363 | 38197,16 |
| 8 | 18 367 384 | 16367454 (0,89112) |
17205394 | 10175198 | 0,59140 | 0.55398 | 0.57208 | 0.57238 | 31221,26 |
| 9 | 18 373 472 | 15330374 (0,83438) |
16132718 | 9380973 | 0,58149 | 0.51057 | 0.54373 | 0.54488 | 26240,48 |
| 10 | 18 371 406 | 14010072 (0,76260) |
14742026 | 8015146 | 0,54369 | 0.43628 | 0.48410 | 0.48703 | 23297,59 |
BWA v 0.7.12
| % of mutations | Quantity | Aligned (Percent) |
Align N | Good | Sp | Sn | F1-Score | G-Measure | Time,sec* |
| 0,5 | 18 363 068 | 18362950 (0,99999) |
18277290 | 17836216 | 0.97587 | 0.97131 | 0.97358 | 0.97359 | 1861.88 |
| 1 | 18 363 276 | 18234432 (0,99298) |
16352253 | 16352253 | 0.91169 | 0.89049 | 0.90097 | 0.90103 | 2193.43 |
| 2 | 18 368 502 | 18242134 (0,99312) |
16981036 | 16981036 | 0.77650 | 0.71785 | 0.74602 | 0.74660 | 2715.63 |
| 3 | 18 361 496 | 18216744 (0,99212) |
15184617 | 12332850 | 0.81219 | 0.67167 | 0.73528 | 0.73860 | 2885.90 |
| 4 | 18 365 644 | 18150184 (0,98827) |
12798496 | 8450889 | 0.66030 | 0.46015 | 0.54235 | 0.55121 | 2808.80 |
| 5 | 18 361 920 | 17985918 (0,97952) |
10210712 | 6876296 | 0.67344 | 0.37449 | 0.48132 | 0.50219 | 2744.36 |
| 6 | 18 364 062 | 17672136 (0,96232) |
7757125 | 5013381 | 0.64629 | 0.27300 | 0.38386 | 0.42004 | 2455.39 |
| 7 | 18 369 140 | 17148746 (0,93356) |
5650432 | 3577670 | 0.63317 | 0.19477 | 0.29790 | 0.35117 | 2117.16 |
| 8 | 18 367 384 | 16367454 (0,89112) |
3960788 | 2389041 | 0.60317 | 0.13007 | 0.21399 | 0.28010 | 1748.40 |
| 9 | 18 373 472 | 15330374 (0,83438) |
2697972 | 1602255 | 0.59387 | 0.08720 | 0.15207 | 0.22756 | 1455.65 |
| 10 | 18 371 406 | 14010072 (0,76260) |
1783120 | 990818 | 0.55567 | 0.05393 | 0.09832 | 0.17311 | 1222.717 |
* Time without indexing of reference genome, which took additional 65 sec.
Bowtie
| % of mutations | Quantity | Aligned (Percent) |
Align N | Good | Sp | Sn | F1-Score | G-Measure | Time,sec* |
| 0,5 | 18 363 068 | 18362950 (0,99999) |
18258558 | 17769803 | 0.97323 | 0.96769 | 0.97045 | 0.97046 | 2449.11 |
| 1 | 18 363 276 | 18234432 (0,99298) |
18054372 | 16276544 | 0.88636 | 0.88636 | 0.88636 | 0.88636 | 2569.75 |
| 2 | 18 368 502 | 18242134 (0,99312) |
17355459 | 13272528 | 0.76475 | 0.72257 | 0.74306 | 0.74336 | 2543.34 |
| 3 | 18 361 496 | 18216744 (0,99212) |
16230075 | 12951743 | 0.79801 | 0.70538 | 0.74884 | 0.75027 | 2446.93 |
| 4 | 18 365 644 | 18150184 (0,98827) |
9582292 | 9582292 | 0.64740 | 0.52175 | 0.57782 | 0.58119 | 2277.48 |
| 5 | 18 361 920 | 17985918 (0,97952) |
13129087 | 8662673 | 0.65981 | 0.47177 | 0.55017 | 0.55792 | 2102.27 |
| 6 | 18 364 062 | 17672136 (0,96232) |
11373687 | 7194946 | 0.63260 | 0.39179 | 0.48389 | 0.49784 | 1854.86 |
| 7 | 18 369 140 | 17148746 (0,93356) |
9596446 | 5946099 | 0.61961 | 0.32370 | 0.42524 | 0.44785 | 1701.03 |
| 8 | 18 367 384 | 16367454 (0,89112) |
7885925 | 4663468 | 0.59137 | 0.25390 | 0.35527 | 0.38749 | 1528.09 |
| 9 | 18 373 472 | 15330374 (0,83438) |
6337211 | 3684500 | 0.58141 | 0.20053 | 0.29821 | 0.34145 | 1350.17 |
| 10 | 18 371 406 | 14010072 (0,76260) |
4935904 | 2681500 | 0.54326 | 0.14596 | 0.23010 | 0.28159 | 1199.94 |
LICENSE AND CITATION
ReadsMap is a free for academic usage. Please contact us at softberry@softberry.com for commercial license.