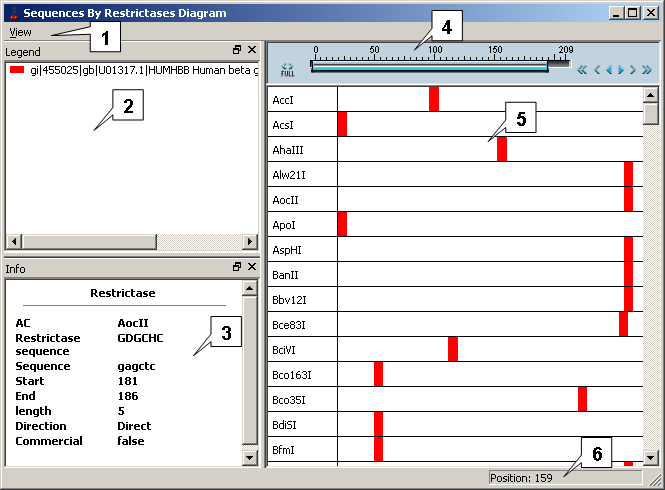
1. Main menu.
2. Legend panel.
3. Info panel.
4. Navigator.
5. Map.
6. Status bar.
|
1. Main menu.
2. Legend panel.
3. Info panel.
4. Navigator.
5. Map.
6. Status bar.
|
Legend panel contains the sequence's ID and a color used for marking the region of restriction site localization on the sequence.
Info panel provides the information on restriction site currently pointed out with mouse cursor.
Navigator works in the same way as described in c. Data visualization
Map. The left part of map contains the restrictases' IDs. On the map the sequence, in which a restriction site is found, is shown as a rectangle. The rectangle is located in a region corresponding to restriction site on the sequence.
Status bar displays information of the current cursor position.