Services Test Online
|
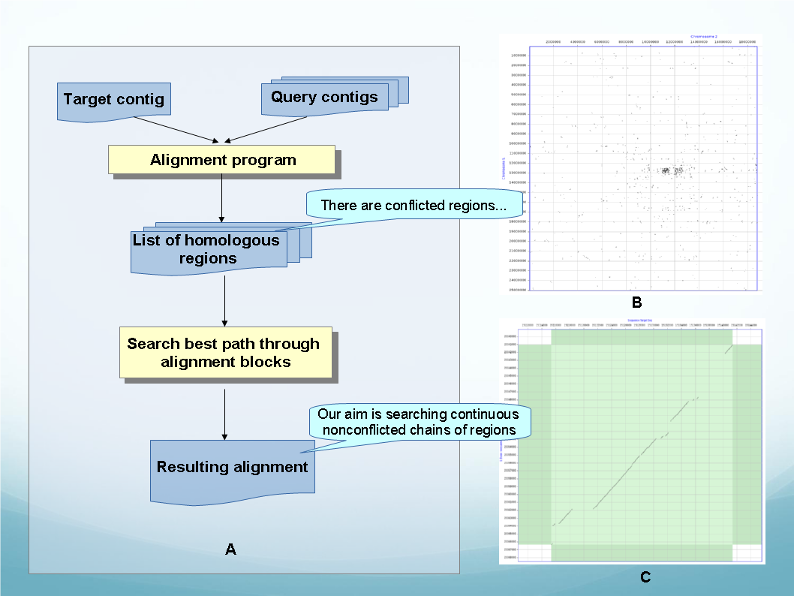
Genome Alignment (Syntheny pipeline) flowchart.
A – Steps for finding all possible alignments for each target contig. B - Sample of initial dotplot matrix. C - Sample of final dotplot matrix. |
Description of method
We propose a software package for aligning large genomic sequences and for finding best coverage of each target sequence by a set of query sequences. The task consists of two sequentially performed steps: First, all possible alignments are found, and then a final alignment (synteny) is constructed by selecting a set of mutually non-contradictory alignments that provide maximum coverage.
The first step, finding initial alignments, is performed as follows:
1. By exhaustive search, find all possible blocks alignment between target and query sequences. To minimize search time, we consider only the segments with sufficient number of k-tuple matches (in current algorithm rendering, k=13) rather than scan entire sequences.
2. Among found alignment blocks, select the most meaningful ones – by length and homology level. We call such blocks anchors.
3. For each anchor, an alignment is extended by adding adjacent blocks. Such extension is performed iteratively, i.e. each iteration adds one more, longest among available, block, provided that gaps between blocks do not exceed specified threshold size. Extension continues until no suitable blocks are left to add.
While constructing a synteny, the following criteria for selection of alignment blocks are used:
1. Final alignment is optimized to have maximum total length of alignment blocks.
2. The program attempts, whenever possible, to use blocks from the same initial alignment, i.e. those located on the same diagonal of dotplot matrix. If switching to another diagonal is necessary, the closest one to the original is selected, i.e. value InDel on a target sequence is minimized.
The input data are target and query sequences in multifasta files.
Initially, using a program for aligning genomic sequences (gsbl), a combined pool of possible alignments is created. Then alignments are sorted by the order they appear along the length of each target sequence. Using methods of dynamic programming, for each target sequence a search is performed for a path that would maximize preselected parameters of final alignment. The result is saved in a binary file (DA format) and can also be output as text alignments of varied degrees of detail
Example of yeast syntheny
Saccharomyces_cerevisiae.fa vs Saccharomyces_arboricola.fa
| Name | Total length | |
| Target | Saccharomyces_cerevisiae.fa | 12157105 |
| Query | Saccharomyces_arboricola.fa | 11558863 |
| Total alignment length | Coverage | Total indel |
| 10306974 (0.84) | 10308616 (0.84) | 1910661 (0.15) |
Visualization by SyGraph web system
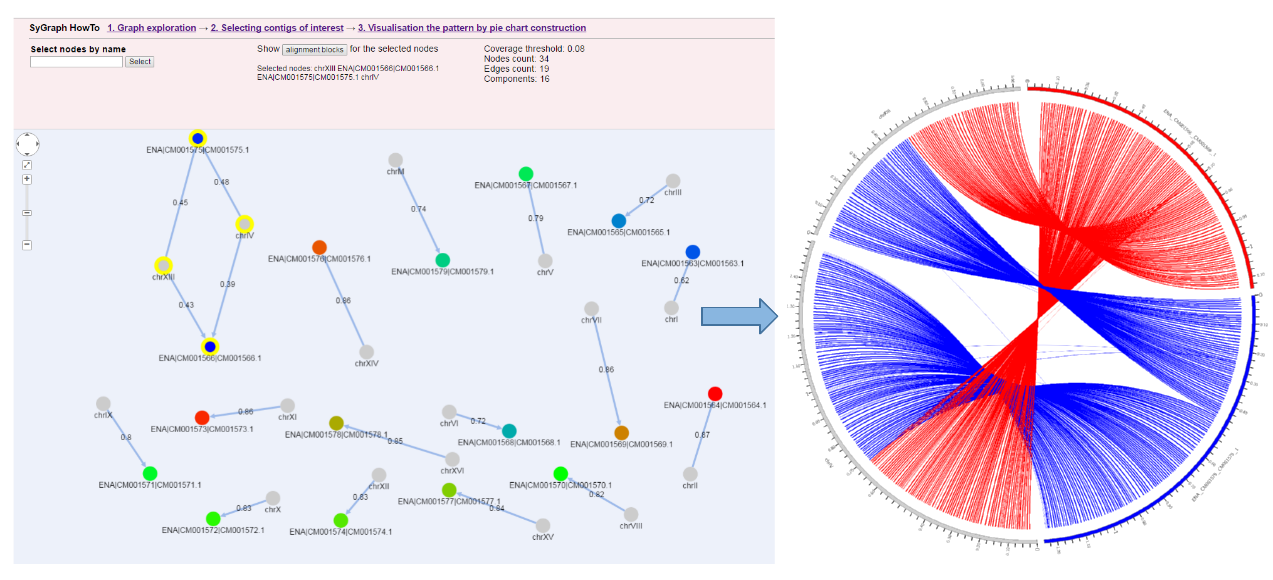
|
| To enlarge the image click on it |