The map provides a schematic visualization of loaded data. The map allows the scaling of the loaded region.
|
In the map area, features are used to be displayed. Each level is shown on its own line. To the left of the map, names of levels are located. For each nucleotide sequence, feature levels with the forward orientation are above and ones with the backward orientation - below the grey line representing a sequence.
New levels can be created either automatically as a result of operation with sequence (e.g., Tools>Motif search), or manually. To create new layout level manually, use the "New feature level" dialog.
On the map, the current cursor position is shown as a vertical line, which is also referred
as "navigation line". To fix a certain position on the map, hold the Ctrl key along with left
mouse button and then replace the cursor to required position. For replacing of previously fixed line,
hold the Ctrl key and place the mouse cursor over the line. When the cursor occurs precisely over the line,
it changes to ![]() shape, and then holding the left mouse button move the line to desired position.
To remove previously fixed line, move it to the area with layers names.
shape, and then holding the left mouse button move the line to desired position.
To remove previously fixed line, move it to the area with layers names.
Mouse right button click on a feature calls out the feature pop-up menu:
 |
The grey line represents a sequence. In the left map part, the levels names are represented. To set on/off the level representation on the map, use the checkbox near the level name in the List of sequences.
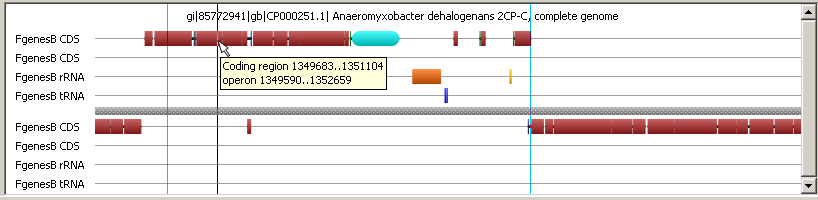
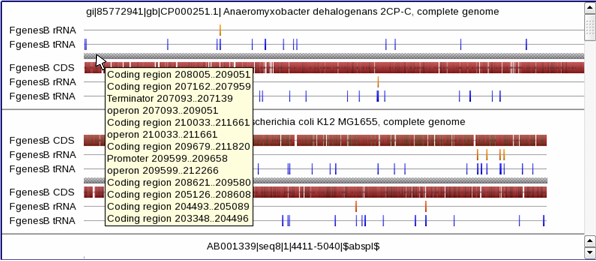
Feature display parameters can be specified in the "Edit feature"dialog. To select a feature, click on it. Selecting a feature causes the appropriate feature name to be highlighted in the "List of sequences" as well as the corresponding sequence to be highlighted on the "Sequence view" panel. If the clicked feature belongs to "CDS" type, the appropriate nucleotide and aminoacid sequences are highlighted on "Sequence view panel"; if the clicked feature belongs to some other type, only nucleotide sequence is highlighted. If multiple features are located at the same map point, click mouse to switch between them. Depending on the cursor position, the pop-up hint with the following information appears:
Features are used to be represented as color rectangles. User may change feature attributes in "Edit feature" dialog.
 |
The cursor position on the map is displayed in the status line.
On mouse clicking on a feature, the sequences in Sequence view panel are being shifted in such a way that allows to display the feature location on the nucleotide sequence and feature name is highlighted in the List of sequences.
Holding the "Shift" key allows to change the map scaling by mouse. The scaling occurs from the map center.
Using the Graphic navigation bar an approximate length of displayed region can be assigned. The Precise navigation bar provides the ability to set the exact borders of region to be displayed.